

Amazon Redshift is a fully-managed, petabyte-scale cloud data warehouse that seamlessly integrates with AWS services. It delivers fast, cost-effective analytics at scale while minimizing operational overhead through automated maintenance and optimization. This powerful platform enables organizations to unlock real-time insights from massive datasets without the complexity of traditional data warehouse management.

Project 1
Unified Redshift Console

When Amazon Redshift launched Serverless at re:Invent 2022, it operated as a separate console from the existing provisioned console. Upon joining the team, I initiated and led a comprehensive UX project to unify the Amazon Redshift console experience, delivering the following key improvements:
Consolidated Redshift provisioned and serverless into a single unified console
Simplify information architecture and create unified side navigation
Enable customers to access and manage both provisioned and serverless resources in one centralized place
My role
Lead UX designer
Duration
Jan 2023 - Sep 2023
Usability Issues With The Two Consoles
The split console architecture created significant friction for database administrators performing routine warehouse setup, maintenance, and performance optimization tasks.
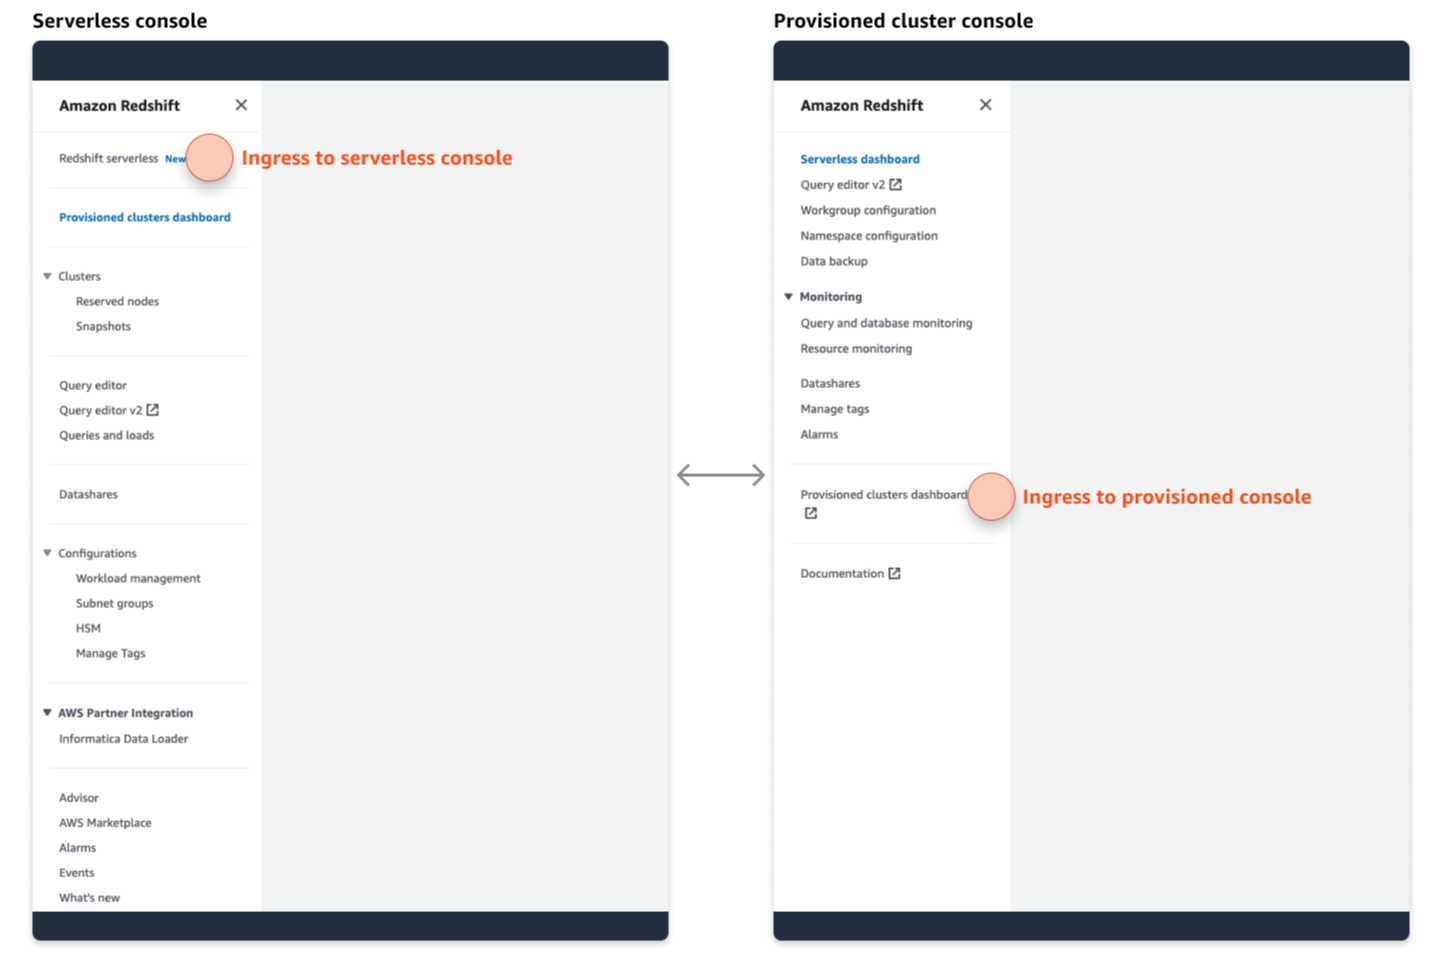
Navigation: Customers were forced to navigate between two separate consoles to monitor and manage provisioned and serverless resources, unlike other AWS services that provide unified management experiences.
Onboarding: New customers are automatically directed to the provisioned console by default, creating a poor onboarding experience for those who might benefit from serverless.
Visibility: There's no centralized way to view metrics across both provisioned and serverless resources.
Inconsistency: Some workflows and terminology varied inconsistently between the two consoles, creating confusion and inefficiency for users managing both resource types.
Information Architecture Redesign
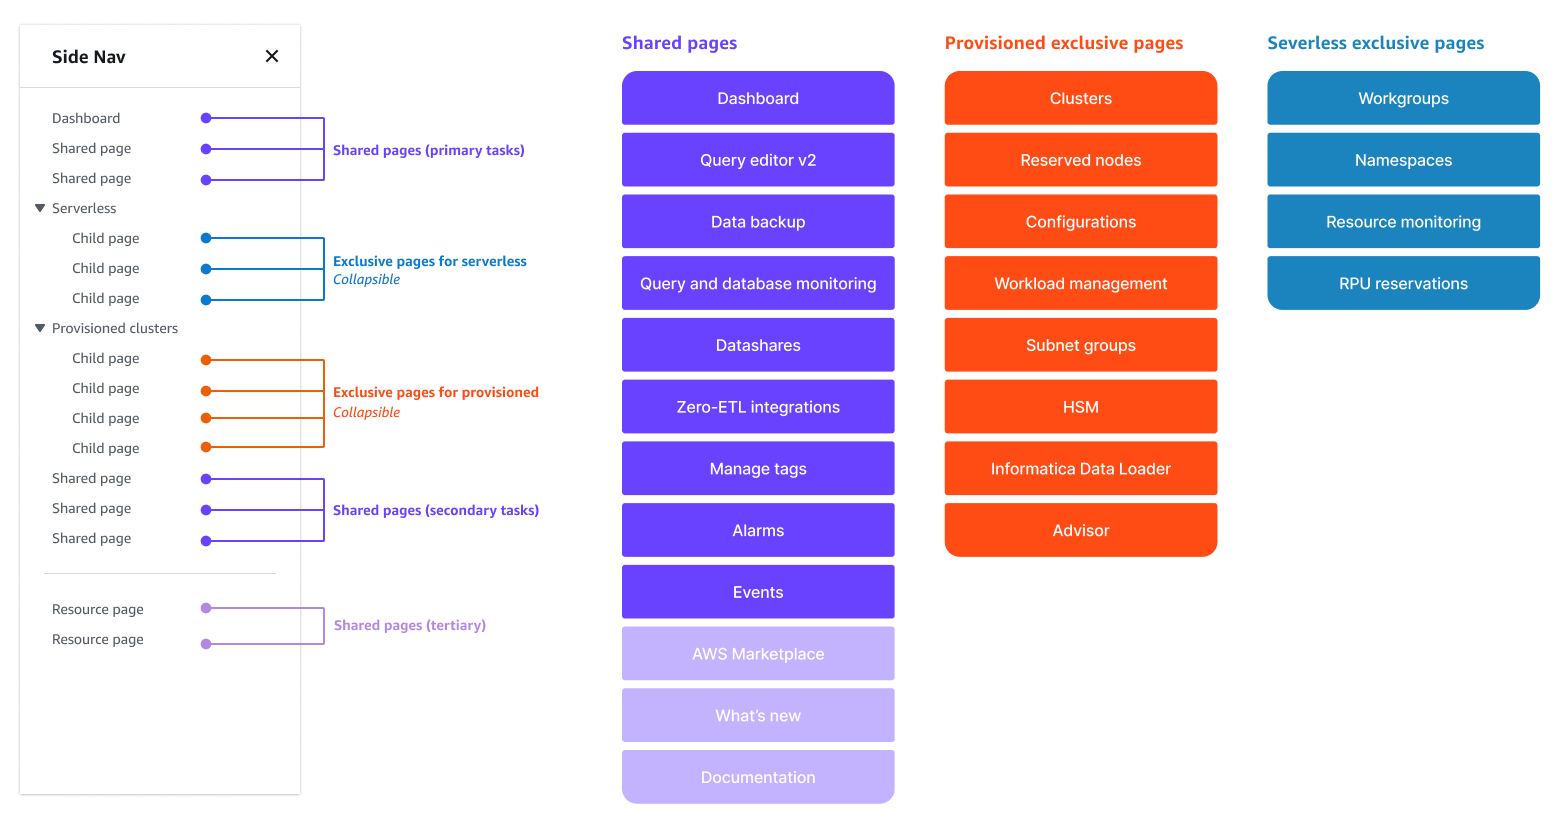
I initiated collaborative workshop sessions with product and engineering managers to align on which resource pages should be shared between provisioned and serverless consoles, grounding our decisions based on customer Jobs-to-Be-Done.
Based on the agreed-upon information architecture, I selected and adapted the most appropriate navigation structure from our design system to support the unified user experience.
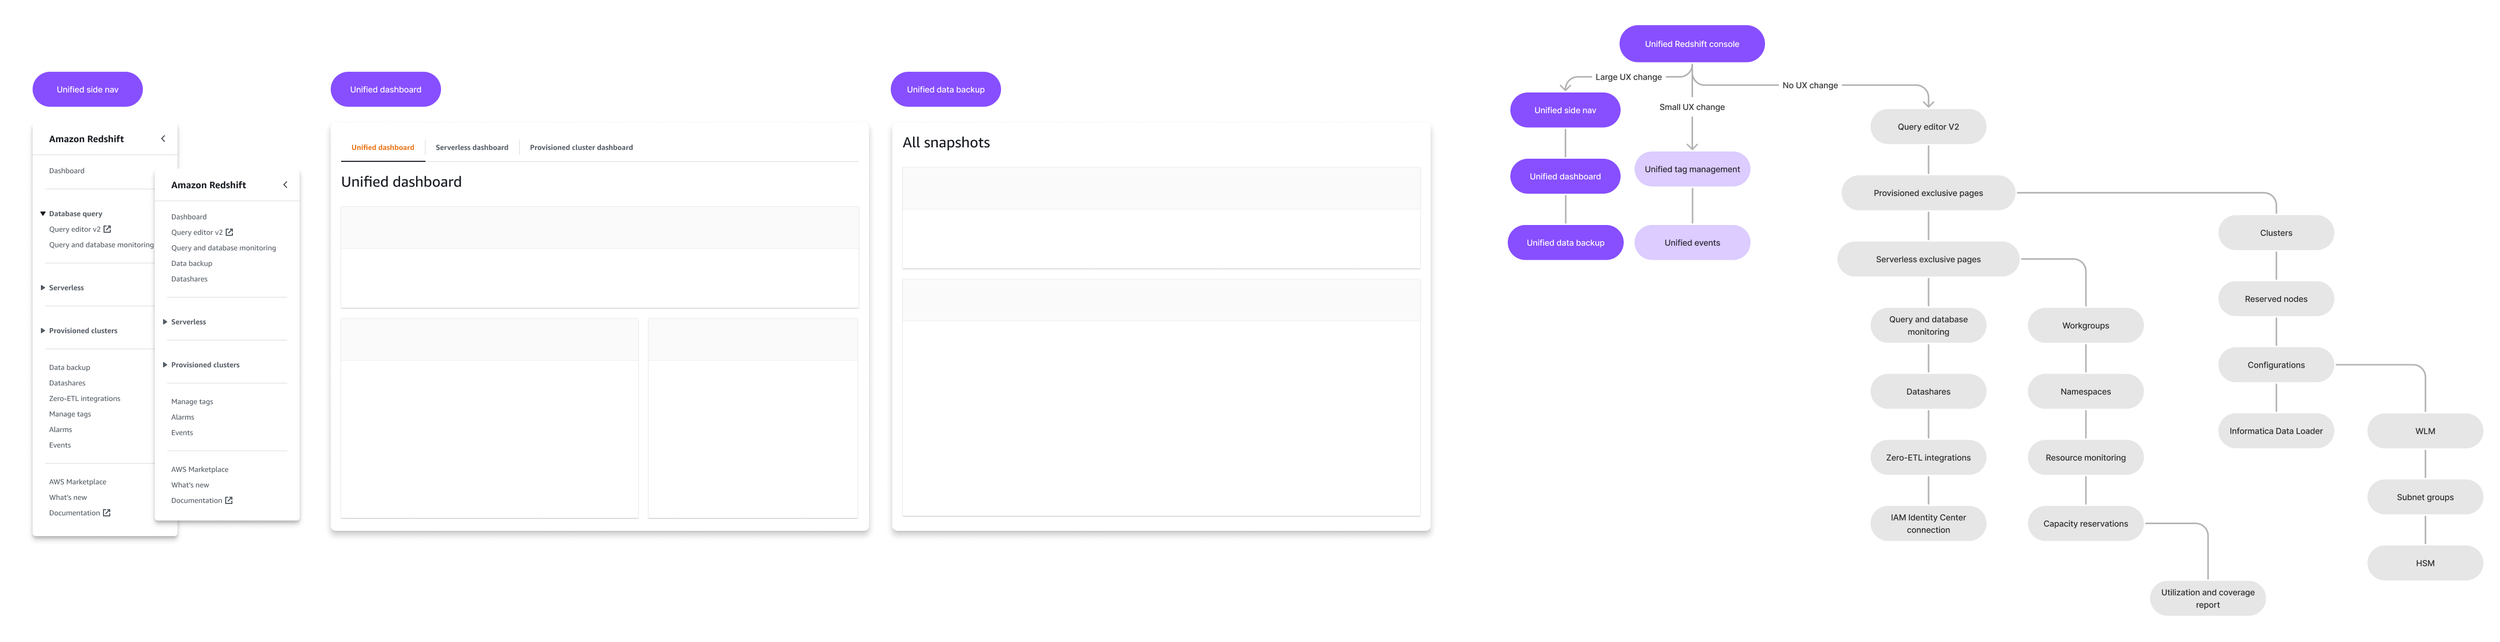
Identify UX Priorities For Testing & Iterations
Given the extensive scope of the IA redesign, I strategically broke down the project into focused UX workstreams based on UX and development effort, and customer impact. I identified three critical areas that would most significantly enhance the customer experience: unified side navigation, unified dashboard, and unified data backup. To validate these design decisions, I prioritized testing the new designs with internal customers before broader implementation.
Customer Feedback & Refinements
I created two prototypes with slightly different information architectures and interactions for the unified console, then conducted user testing with 8 internal Amazon customers. All participants strongly favored having a unified console where they could monitor, configure, and manage both provisioned and serverless resources from a centralized location.
The new information architecture was well-received, with users navigating seamlessly without confusion. Among all tested user flows, the unified dashboard and snapshot features received the highest praise for streamlining daily workflows.
Beyond the positive feedback, customers expressed a desire for greater standardization in UI layouts and terminology across resource management pages.
Unified Dashboards

Based on customer feedback, I further standardized UI layouts and clarified product terminology across provisioned, serverless, and unified dashboards to create a cohesive user experience. I restructured the information hierarchy by strategically positioning frequently accessed metrics to optimize workflow efficiency and reduce task completion time.
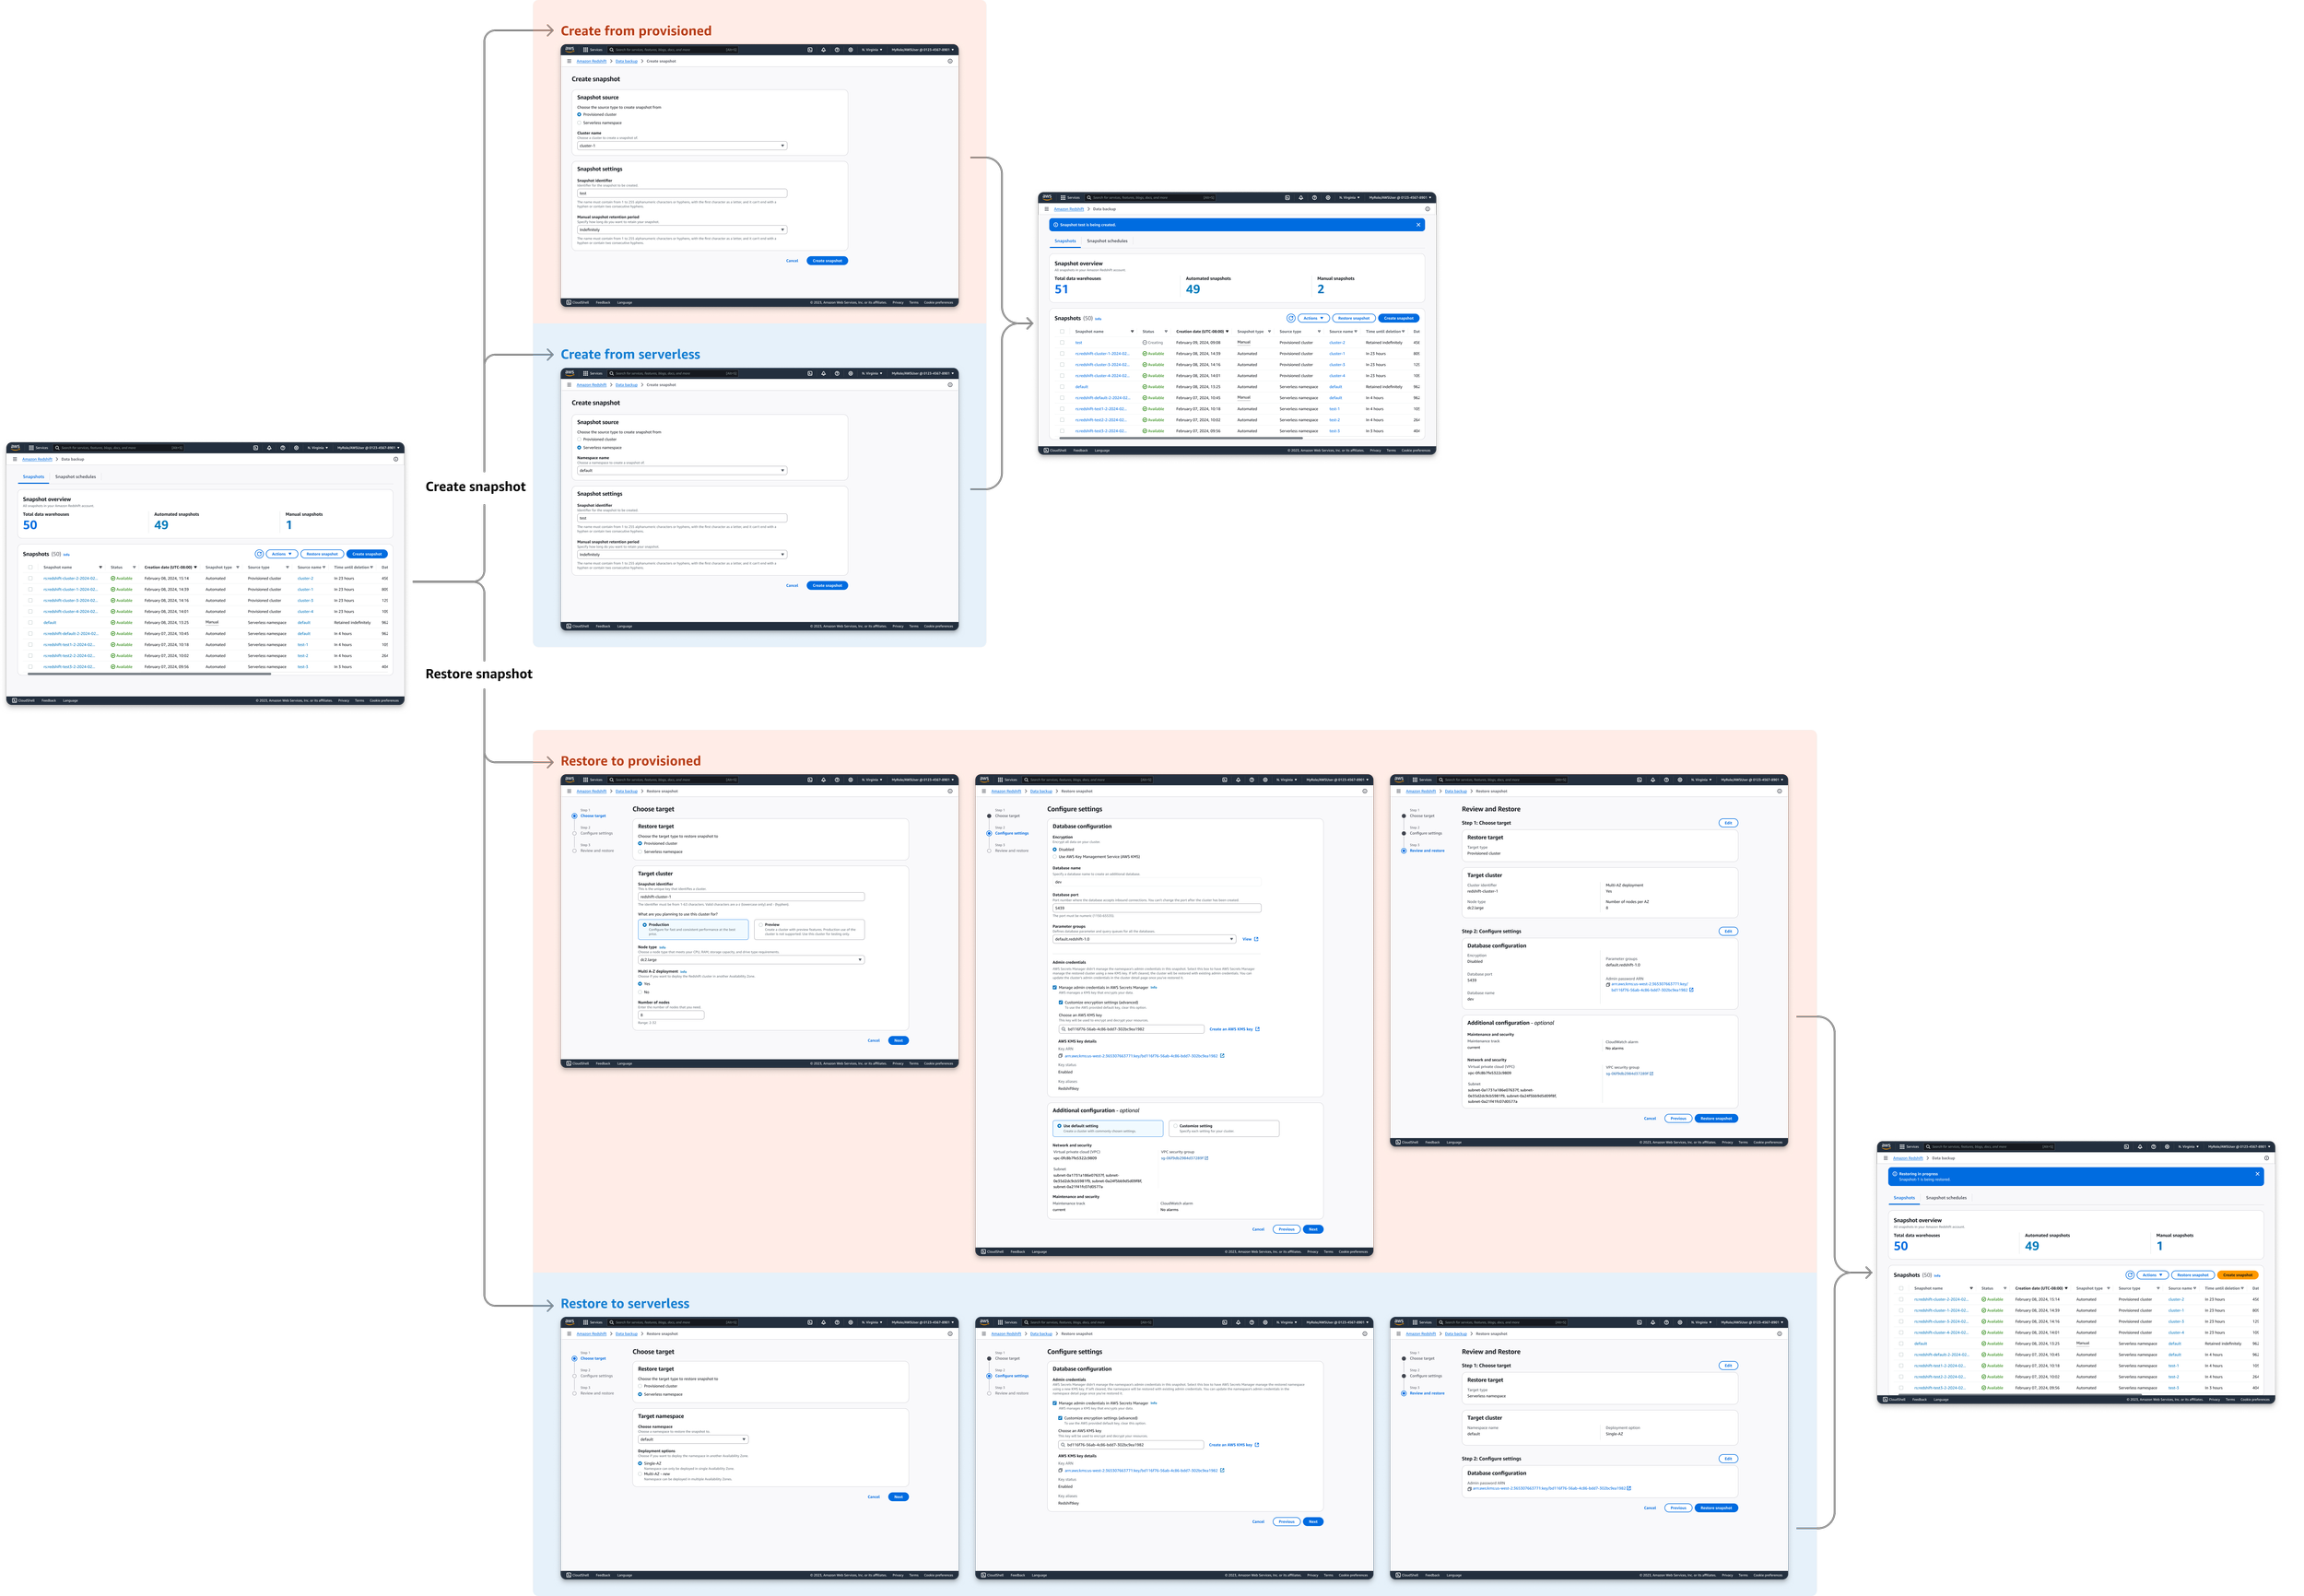
Unified Snapshot Management

I unified data backup management by consolidating provisioned and serverless snapshots into one centralized place with consistent terminology.
The new wizard-driven workflows streamlined snapshot creation and restoration processes, eliminating cross-console navigation complexity for customers.

Project 2
Redshift Query and Database Monitoring

Redshift's primary users, database administrators and engineers, heavily rely on system tables to diagnose cluster and query performance due to the lack of cohesive and comprehensive metrics within the console interface.
To address this critical gap, I designed and implemented an intuitive monitoring system for the Redshift console that transforms complex database metrics into actionable insights through interactive data visualizations.
This solution empowers database administrators and engineers to optimize data warehouse performance with greater precision and confidence, eliminating the need to query system tables manually..
My role
Lead UX designer
Duration
Oct 2023 - Mar 2024

User Personas, Journey & Tasks
UX Solution & Key Values
After multiple iterations with database engineers, we created an interface that provides overview-level warehouse metrics with progressive drill-down capabilities for individual queries and users, delivering a flexible observability experience. Users can:
• Monitor Performance
• Analyze Query Execution
• Identify Bottlenecks
This solution transforms complex system table data into clear, actionable insights through intuitive data visualization, empowering database teams to make informed optimization decisions.
Monitor Performance
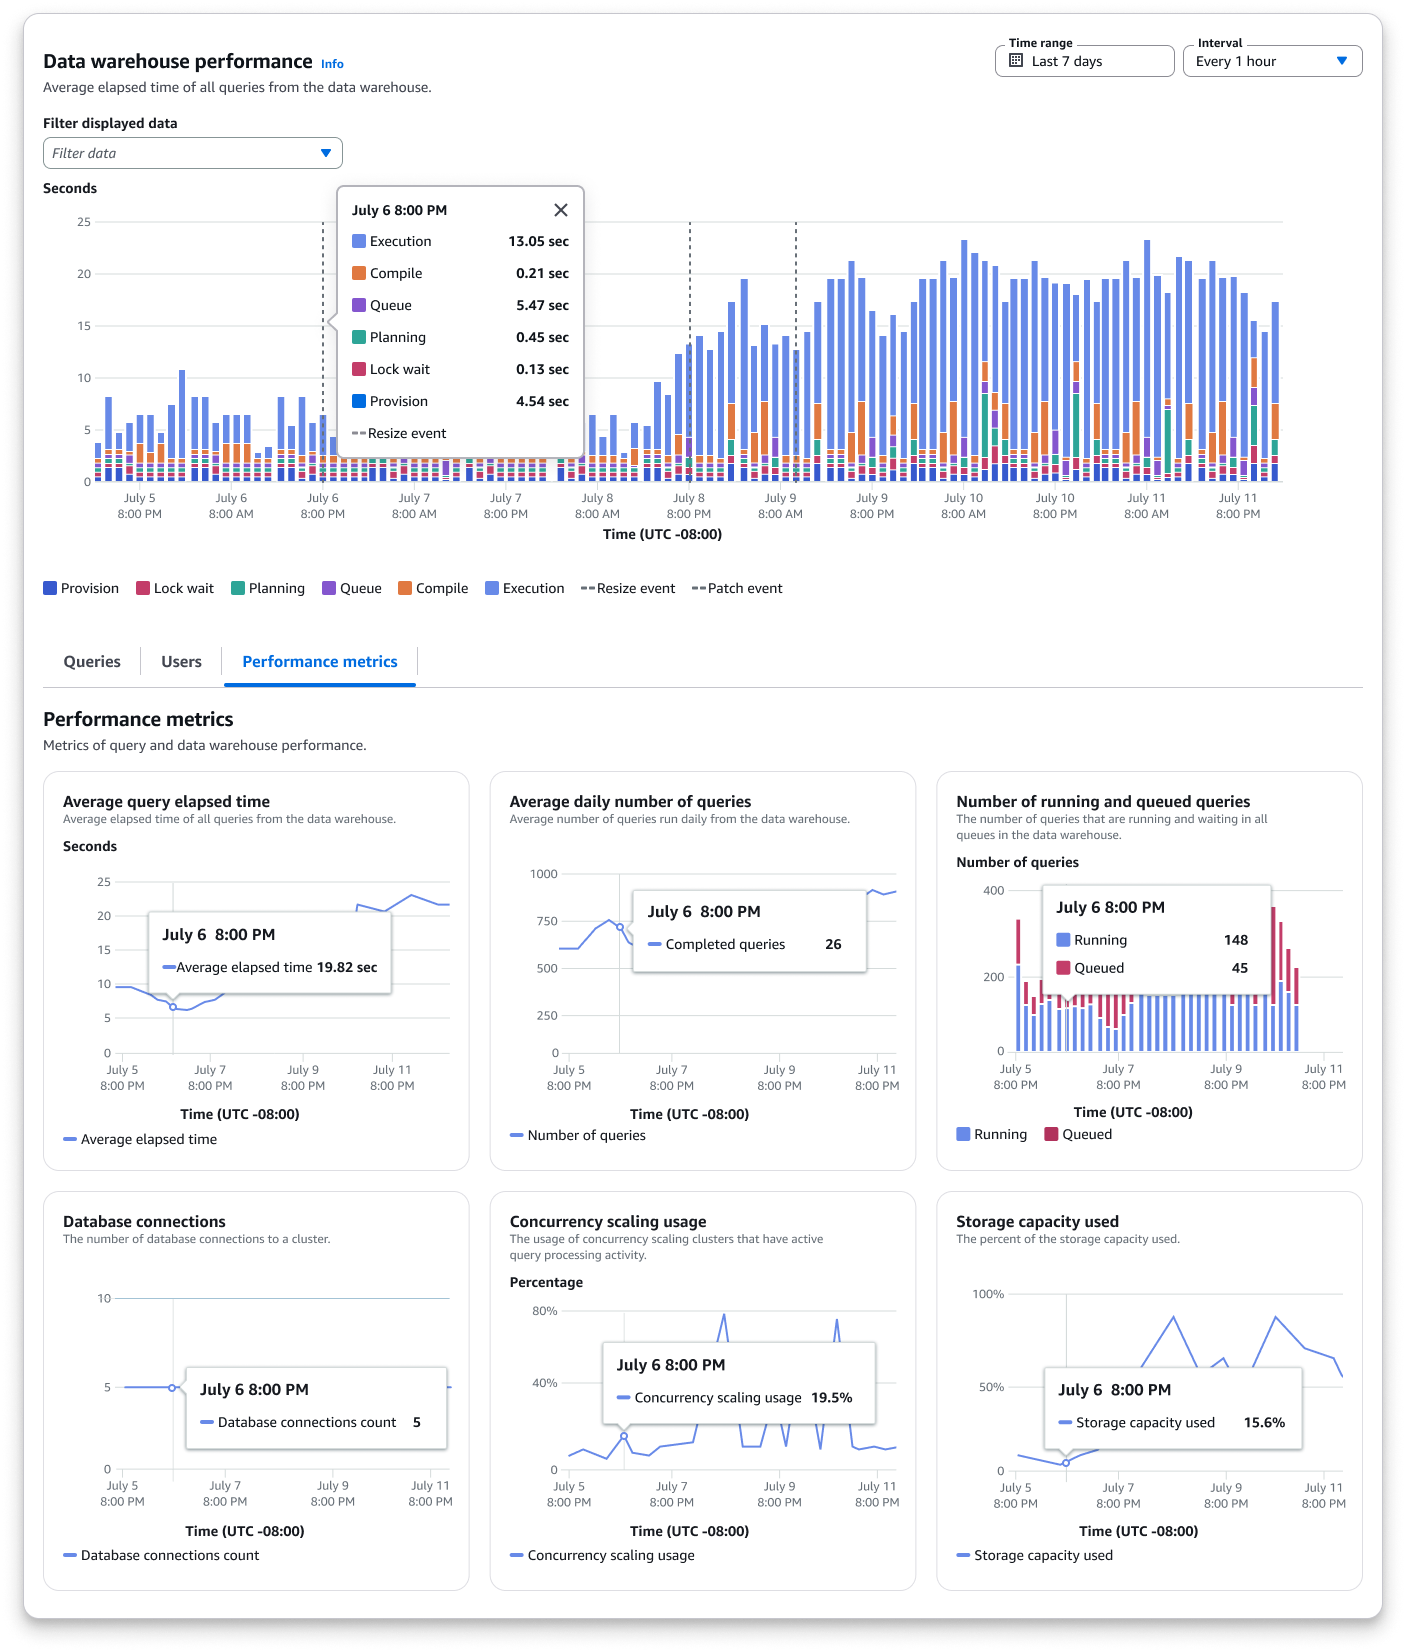
Users can track real-time and historical cluster metrics with customizable time ranges and granularity, gaining comprehensive visibility into data warehouse performance through synchronized metrics dashboards with unified time controls.
Analyze Query Execution
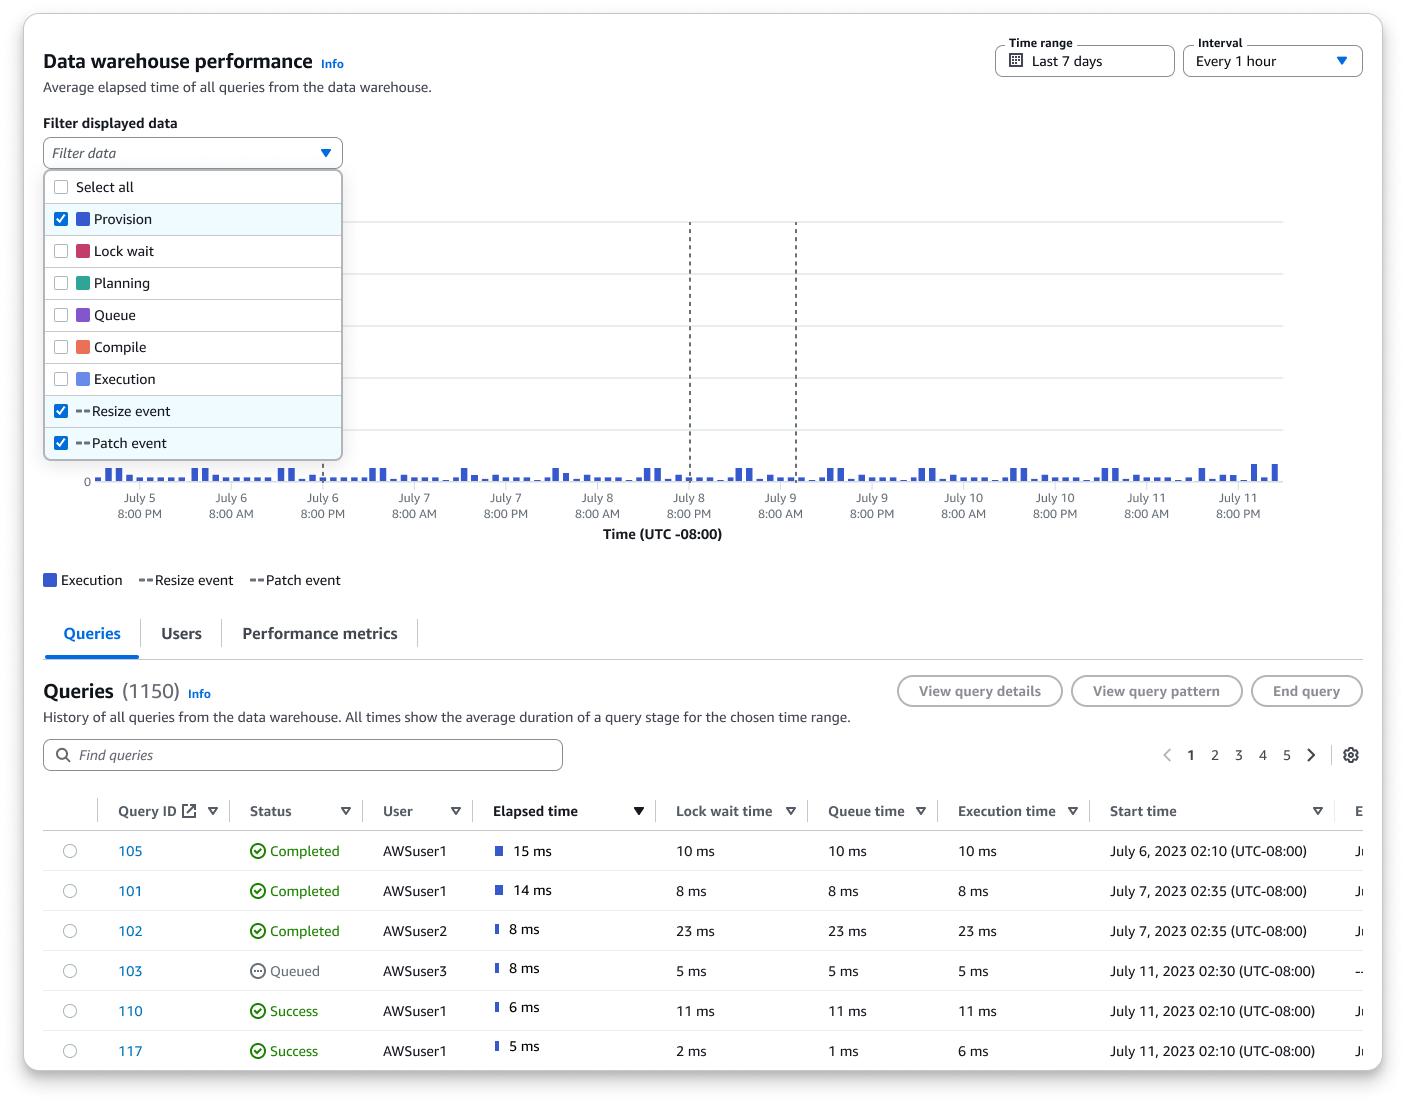
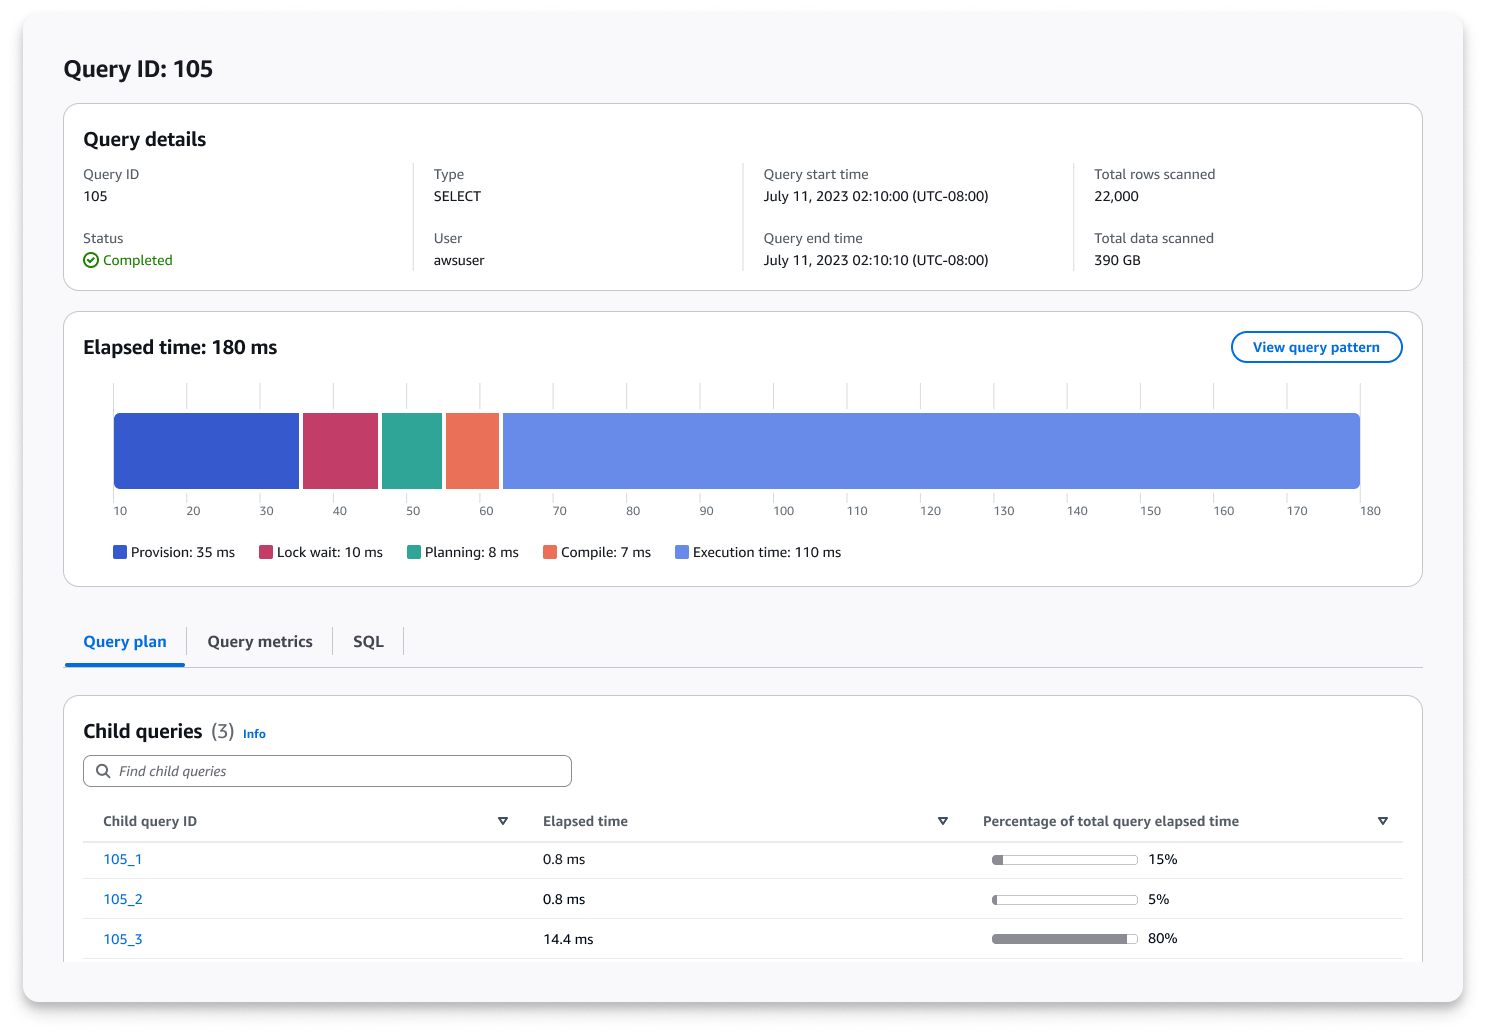
Users can dissect complete query lifecycles with detailed breakdowns of compilation, execution, and wait times, then drill down into specific lifecycle phases to diagnose performance bottlenecks and identify optimization opportunities.
Identify Bottlenecks
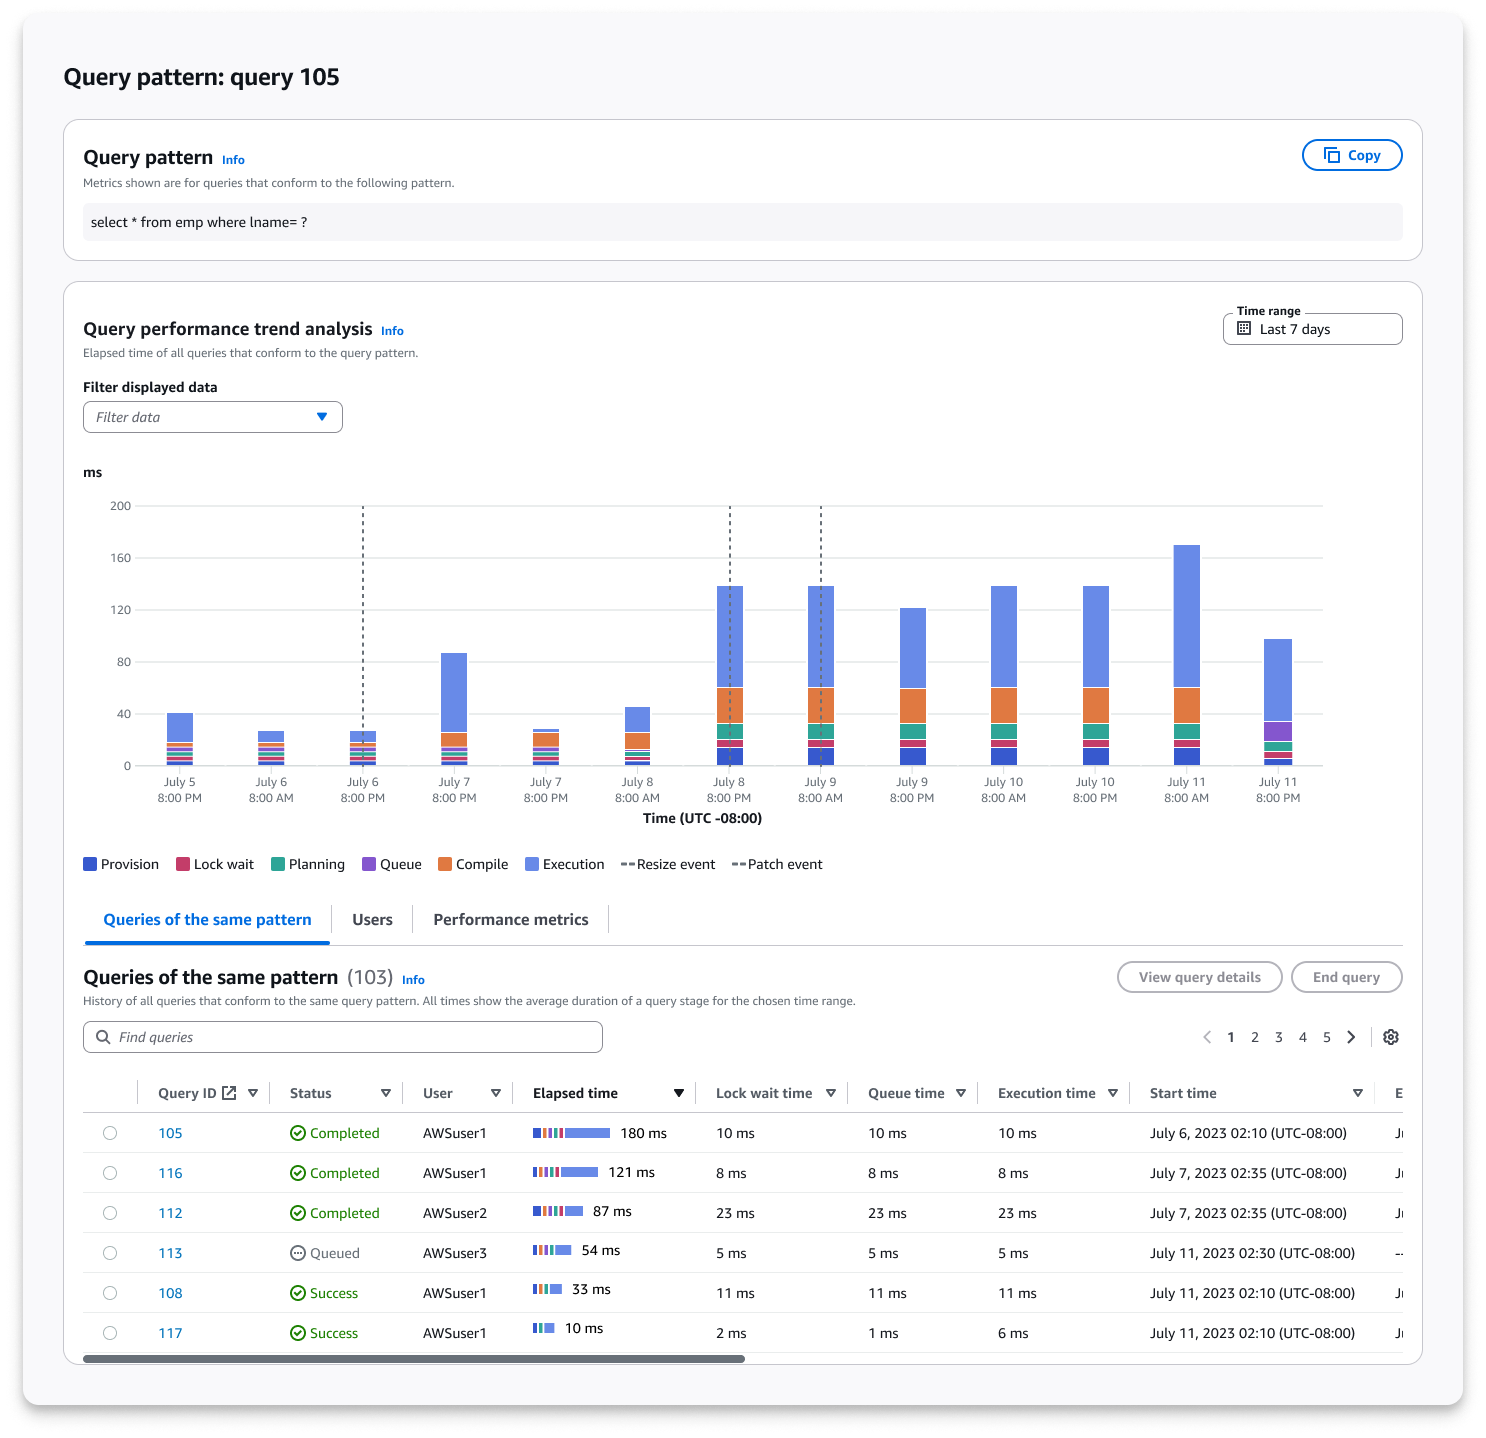
Users can analyze query patterns and their system resource impact to pinpoint performance issues, with the ability to view individual query details and performance trends for queries sharing similar patterns.