
Amazon Quick Sight is a cloud-based business intelligence service that enables organizations to transform raw data into actionable insights at scale. It offers a complete analytics solution, starting with robust data preparation capabilities where users can clean, transform, and model their data. Users can then create interactive dashboards, pixel-perfect reports, and embed analytics directly into their applications. With Quick Sight, organizations can unify their analytics workflow in one platform, making it easier to democratize data across their business.
As the sole founding designer, I built Quick Sight data preparation experience from scratch, democratizing data preparation for analysts through an intuitive interface that simplifies data cleaning and semantic enrichment for BI and agentic analytics in Amazon Quick Suite.
My role
Founding designer
Duration
Nov 2024- Current
Legacy Data Prep
The new experience was designed to replace Quick Sight's legacy data preparation tool, which had critical limitations holding Quick Sight back in Gartner's self-service BI rankings:
Limited UI-based transformations — Only joins and filters were available through the interface, forcing users to write custom SQL for other data prep tasks. This blocked less technical users like analysts from self-service preparation.
Outdated visual design — The legacy interface used deprecated UI components and needed a comprehensive visual refresh.
No data modeling — Unlike competitors (Tableau, Power BI), Quick Sight lacked multi-table data modeling capabilities, preventing users from maintaining data integrity and optimizing query performance.
Missing semantic layer — Datasets lacked metadata and business definitions, making it difficult for analysts and AI agents to understand which data to query
New Data Prep Architecture

I collaborated closely with product and engineering teams to define the architecture of the new data preparation tool through nearly a year of exploration and iteration, often without complete clarity on the final scope. While the architecture above represents the final outcome, the journey to get there was non-linear and iterative.
Given the project's scale, we broke it into three strategic milestones:
Data layer — Multi-step transformations within single-table datasets
Semantics layer: Modeling — Multi-table datasets with data modeling capabilities
Semantics layer: Definitions — Metadata, business definitions, and reusable metrics
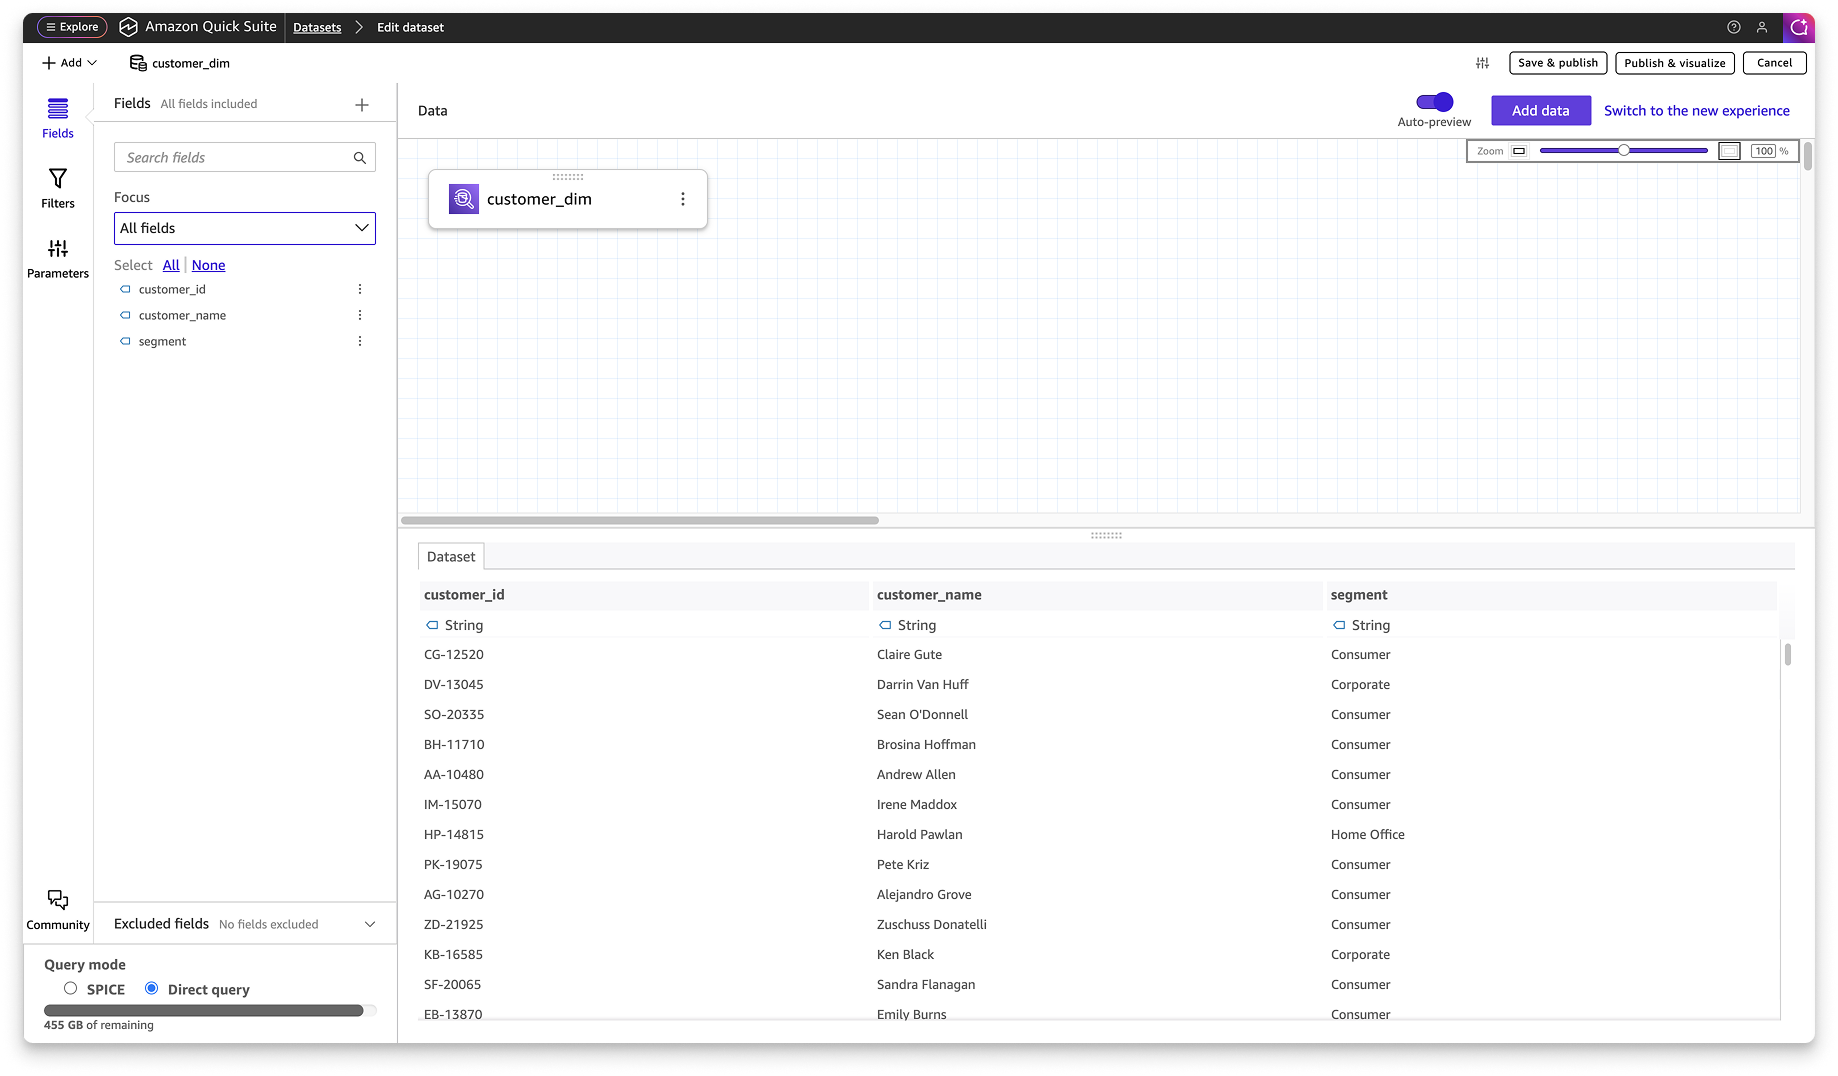
Multi-step Data Transformation
Milestone 1The multi-step transformation workflow empowers users to prepare data through a visual, sequential process by allowing them to see each step, validate outputs, and iterate by modifying earlier steps.
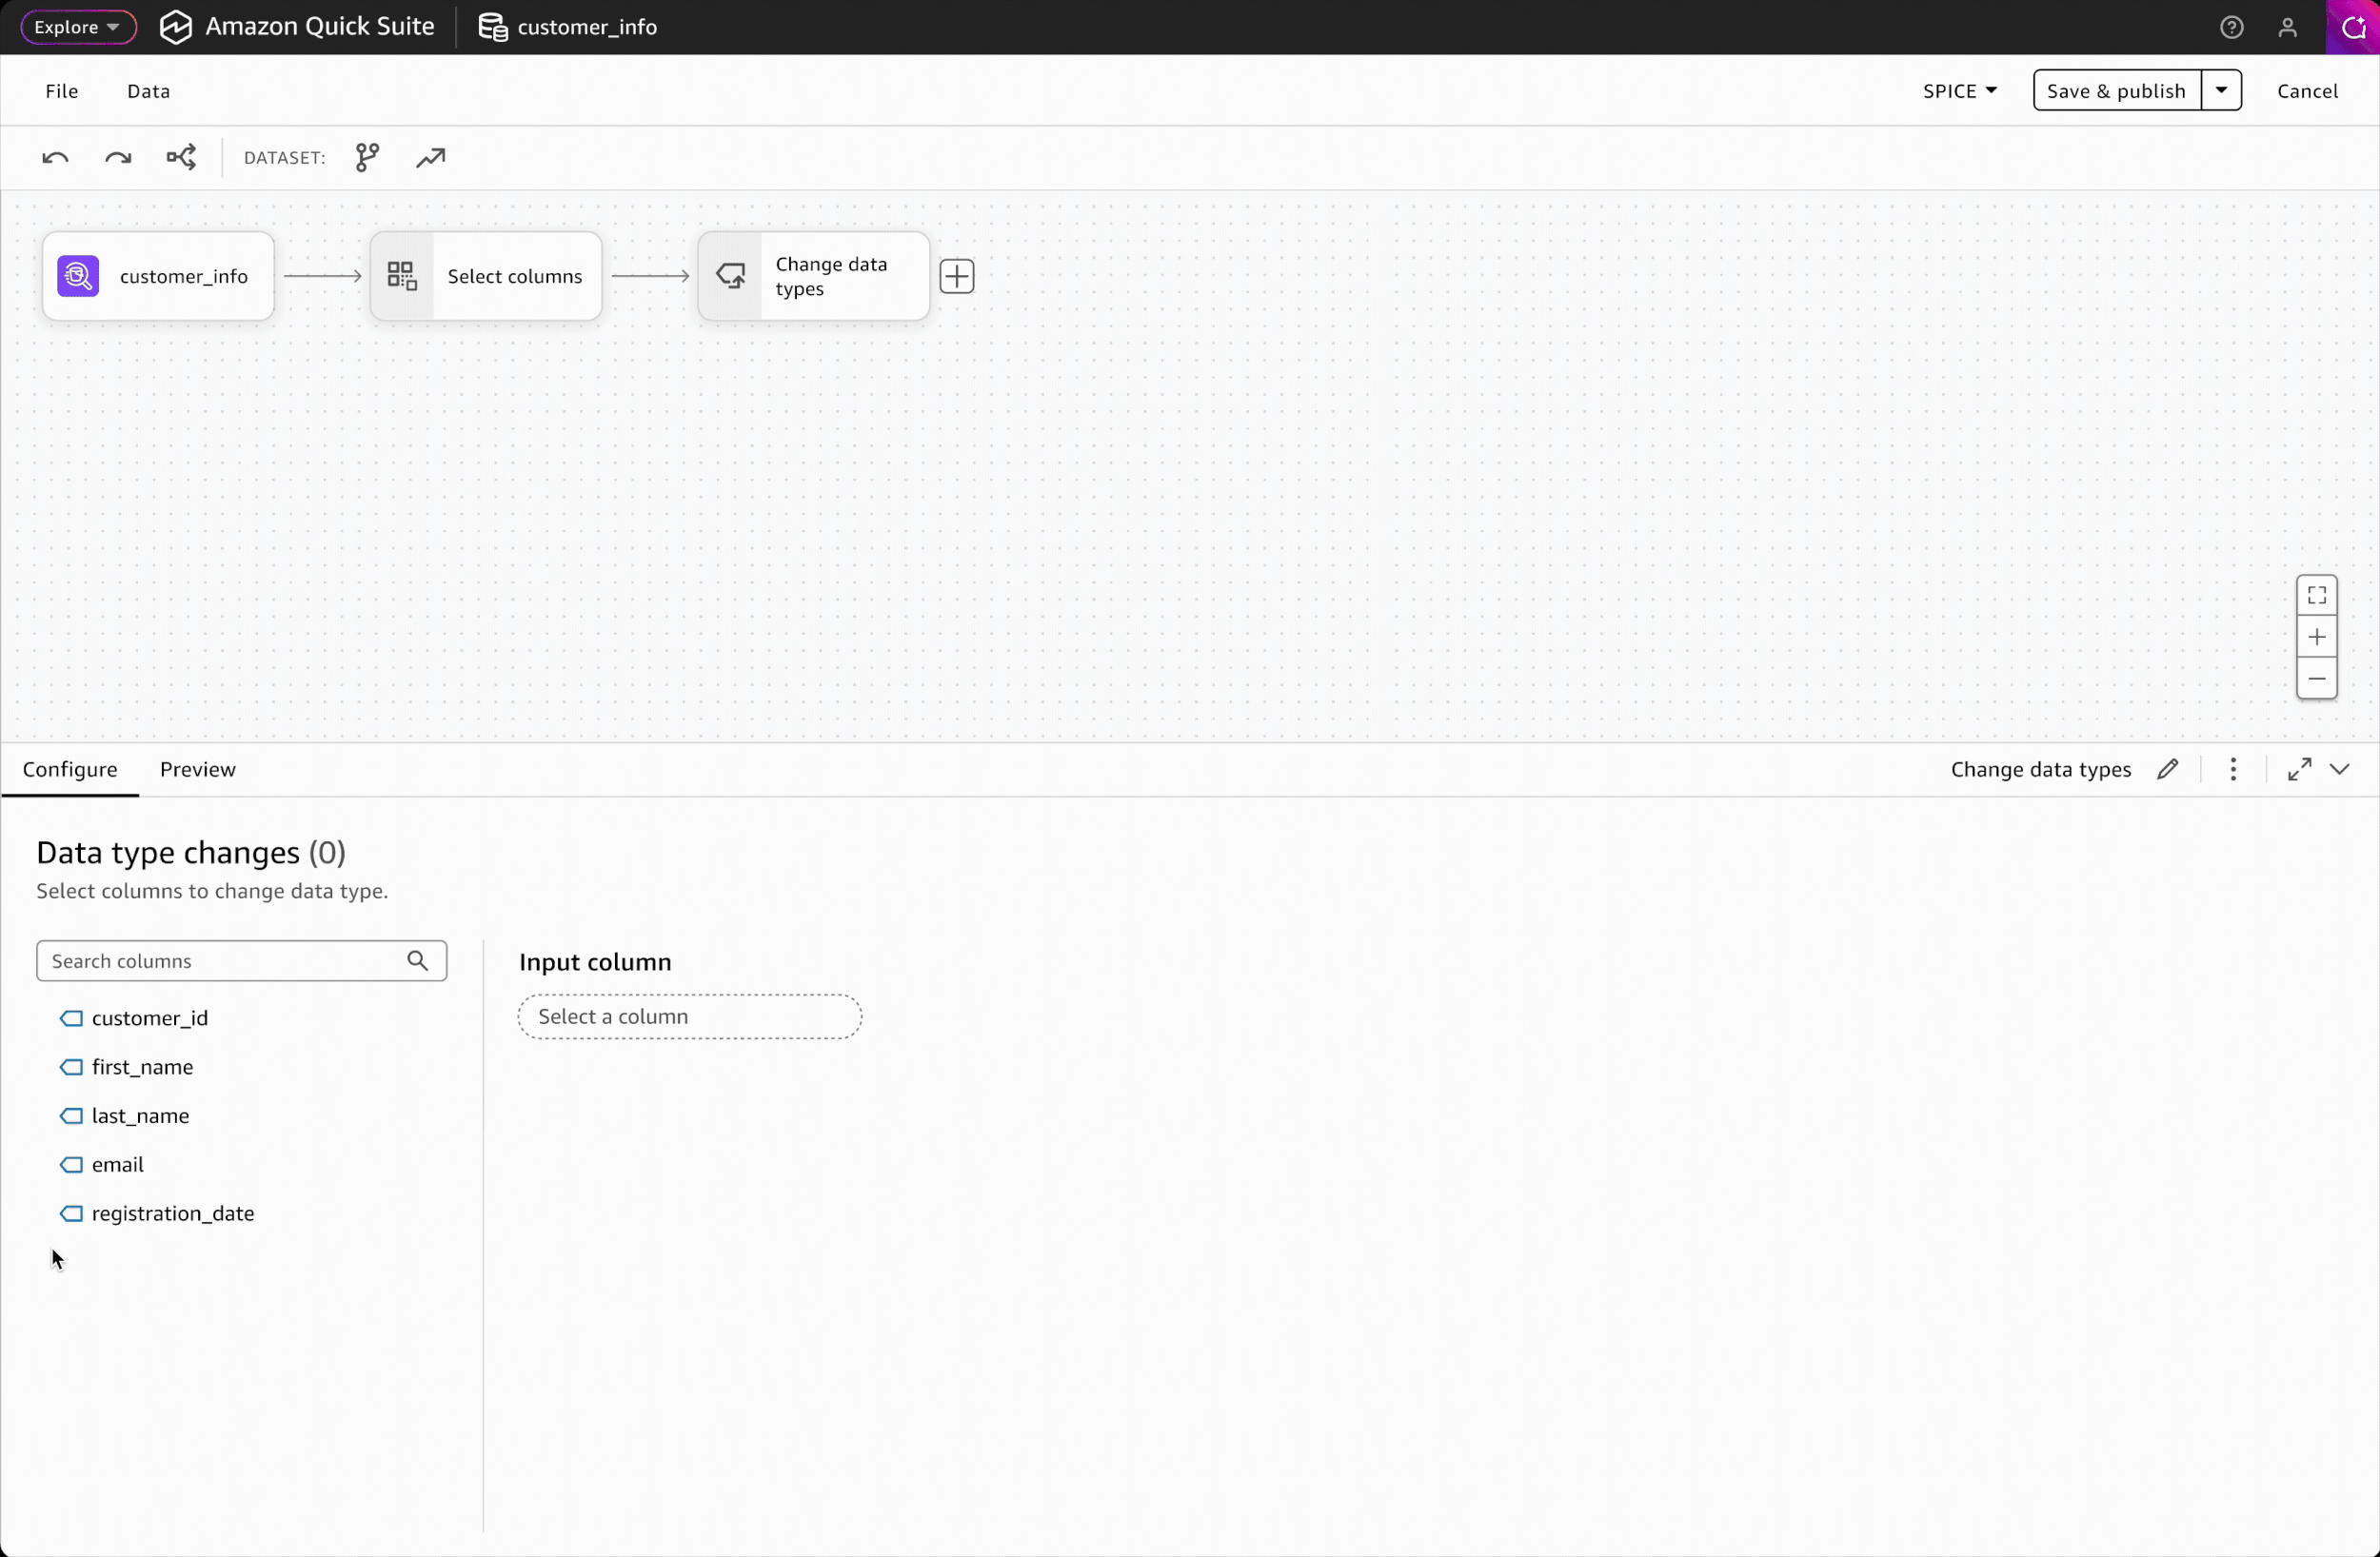
At launch, we prioritized 10 essential transformations for the interface. These are add calculated columns, aggregate, append, change data type, filter, join, pivot, rename columns, select columns, and unpivot.
Data Transformation flow
The multi-step transformation flow is essential to visual data preparation, giving users transparency into how their data changes at each stage and the flexibility to revisit and refine any step in the process.
Interaction Design: Adding Steps
Adding steps is the most frequent action in building a workflow. To ensure a seamless and efficient experience, I designed two intuitive entry points: a side panel and an in-place context menu. Key design decisions include:
Trade-off 1: Click-based interaction over drag-and-drop
Drag-and-drop wasn't feasible for V1 due to engineering constraints. To ensure click-based adding was intuitive and discoverable, I carefully designed the interaction patterns and placement of entry points to make the workflow self-evident.
Trade-off 2: Alphabetical listing over categorical grouping
Without usage data on which transformations are most common, we chose to display all transformations alphabetically rather than impose subjective groupings. This is a reversible decision that can be revisited once we have data to inform meaningful categorization.
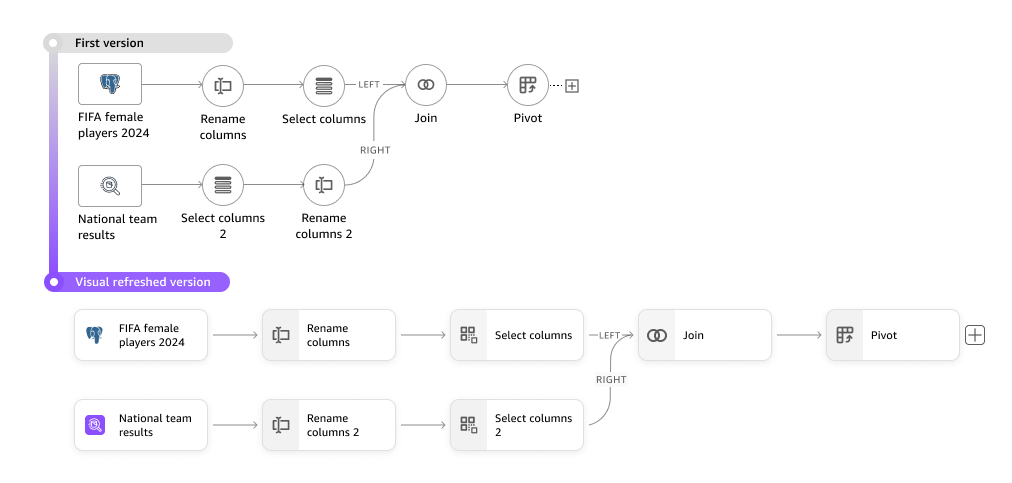
Visual Refresh
I proactively led a visual refresh of the data transformation workflow to align with Amazon Quick Sight's updated branding and design system.
Given data prep's technical nature, I prioritized task-oriented UI over pure visual styling, carefully balancing space density, color usage, and visual clarity to maintain task efficiency while achieving brand consistency.
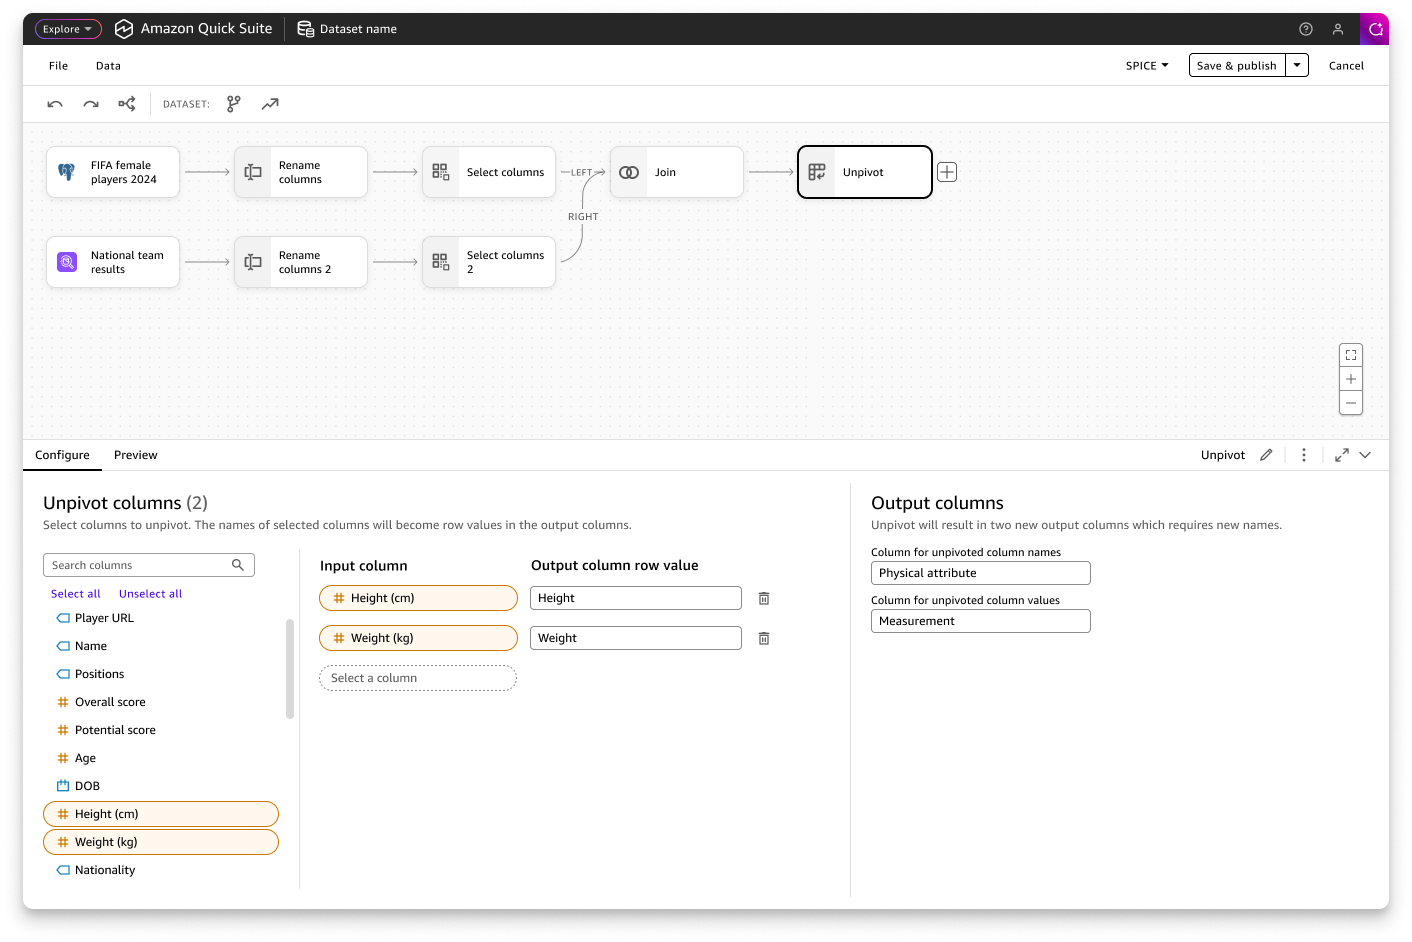
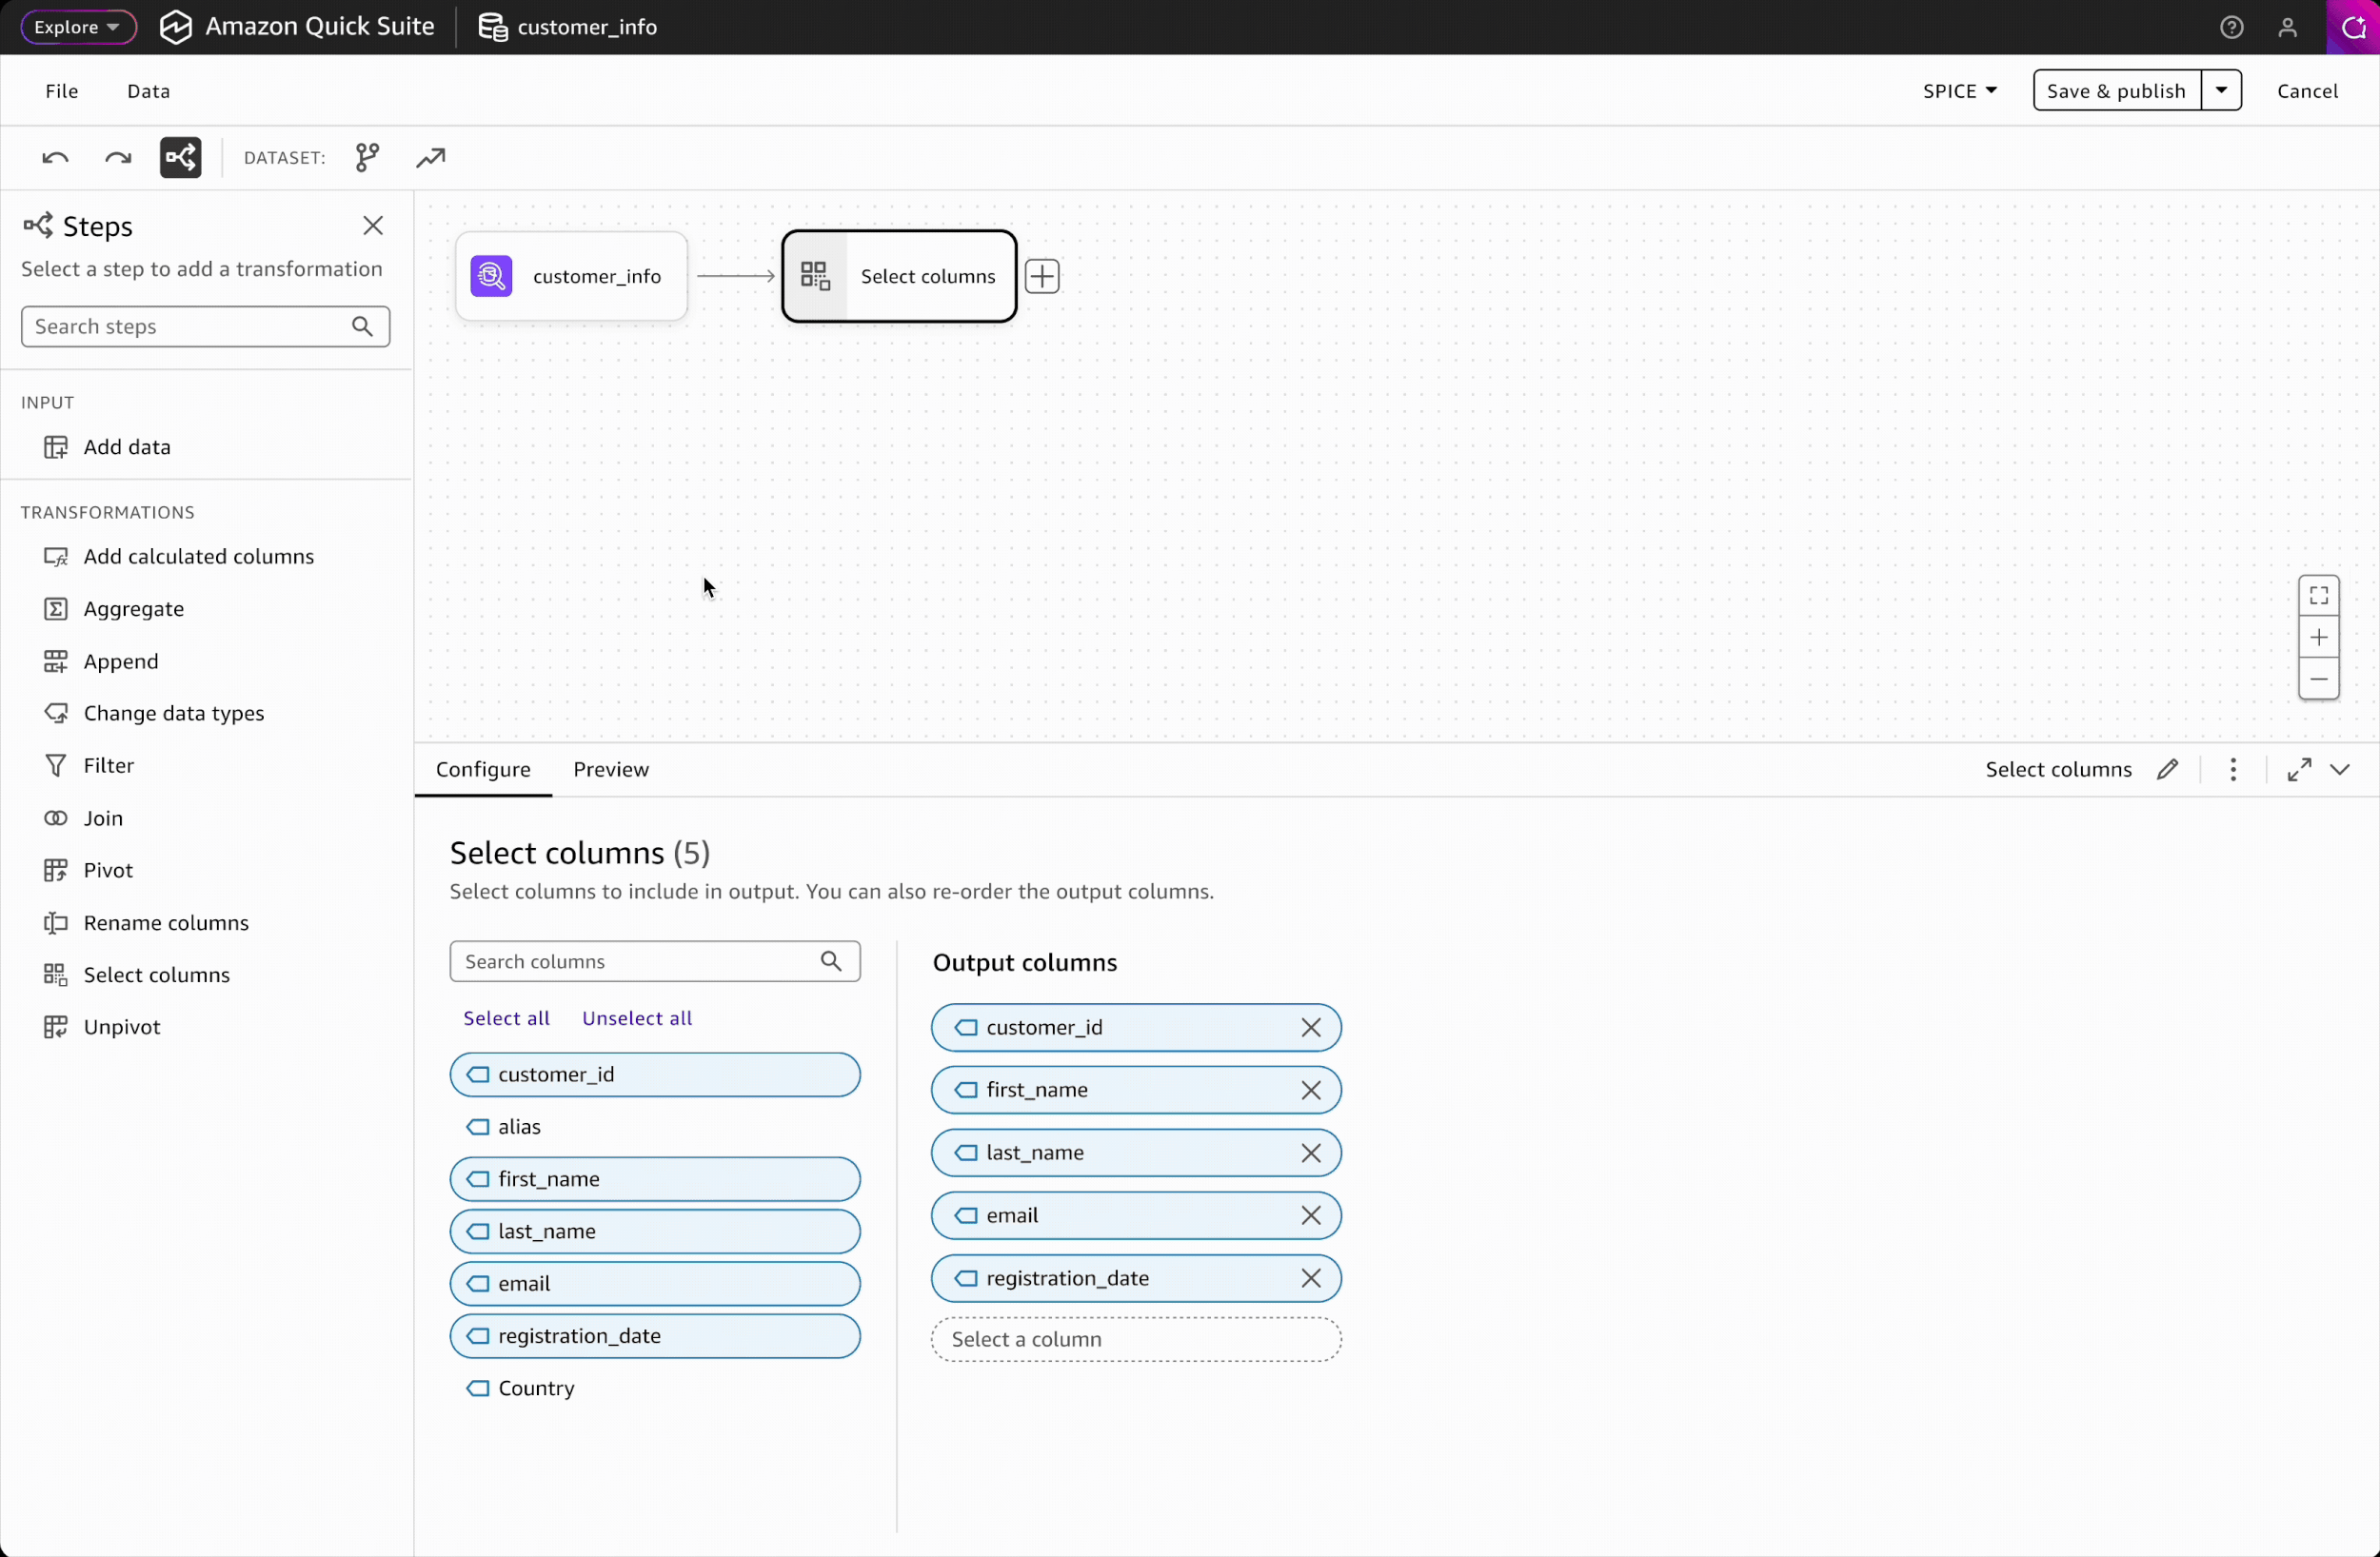
Transformation Interface
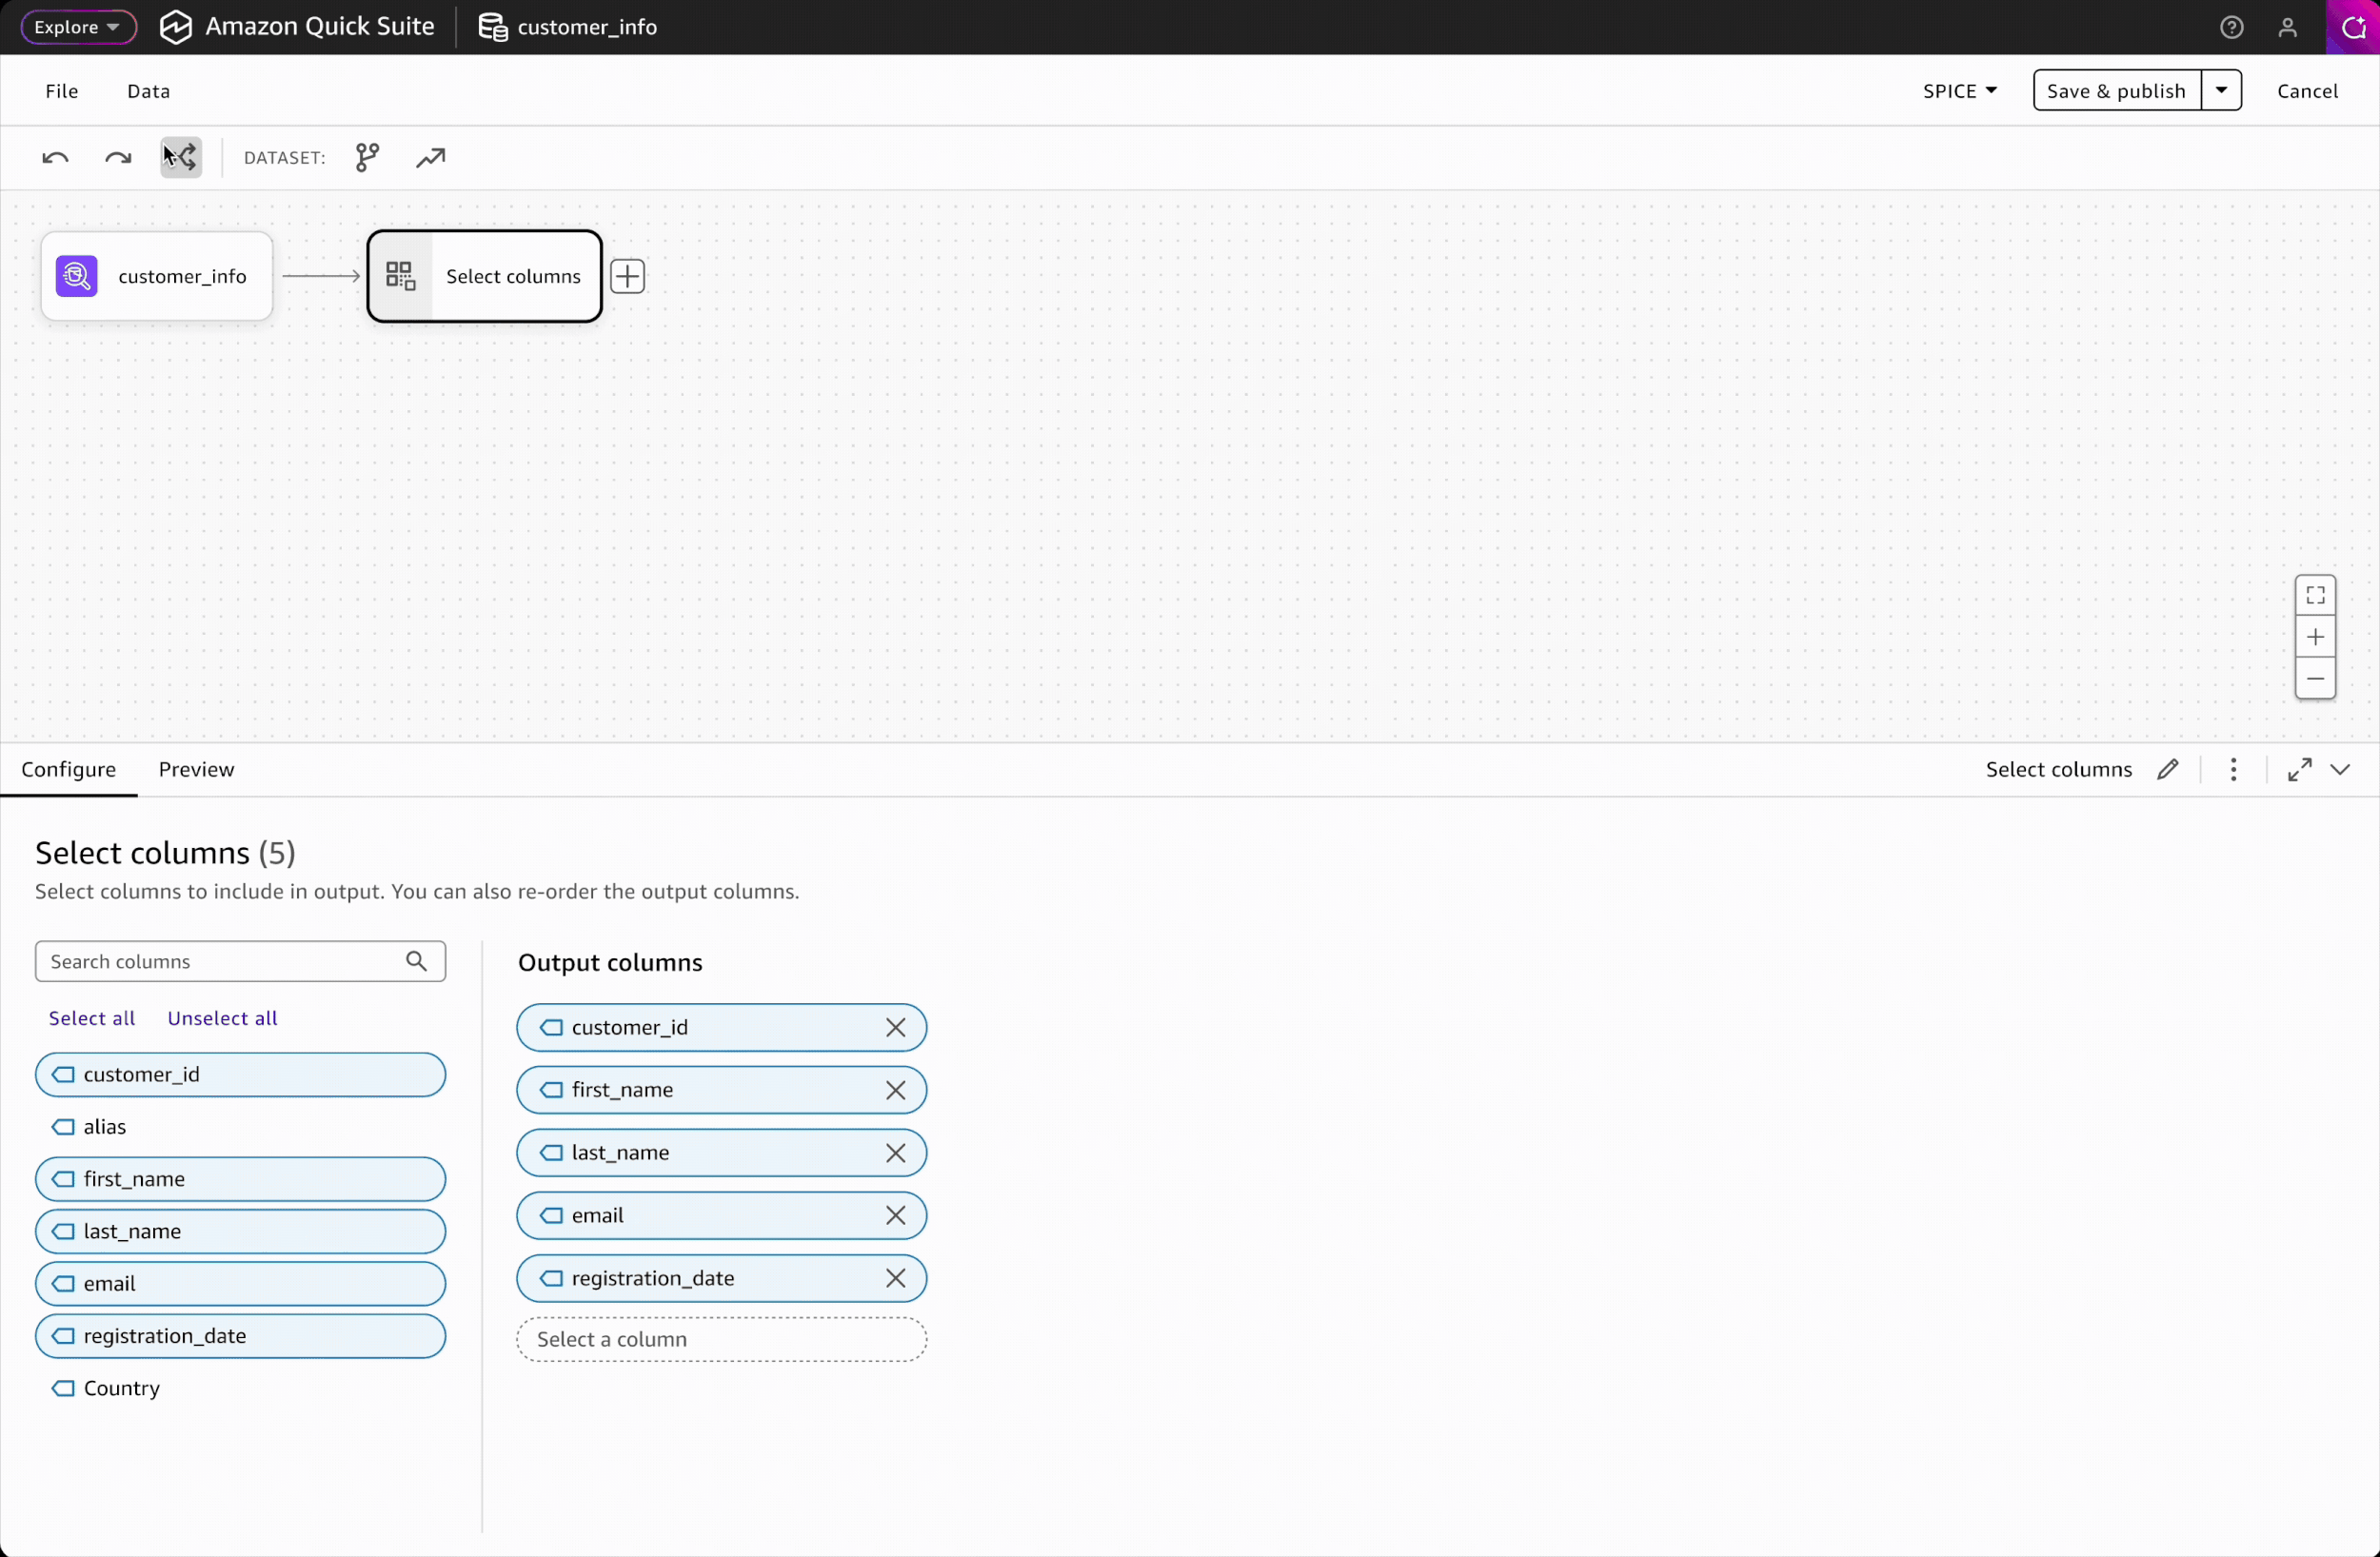
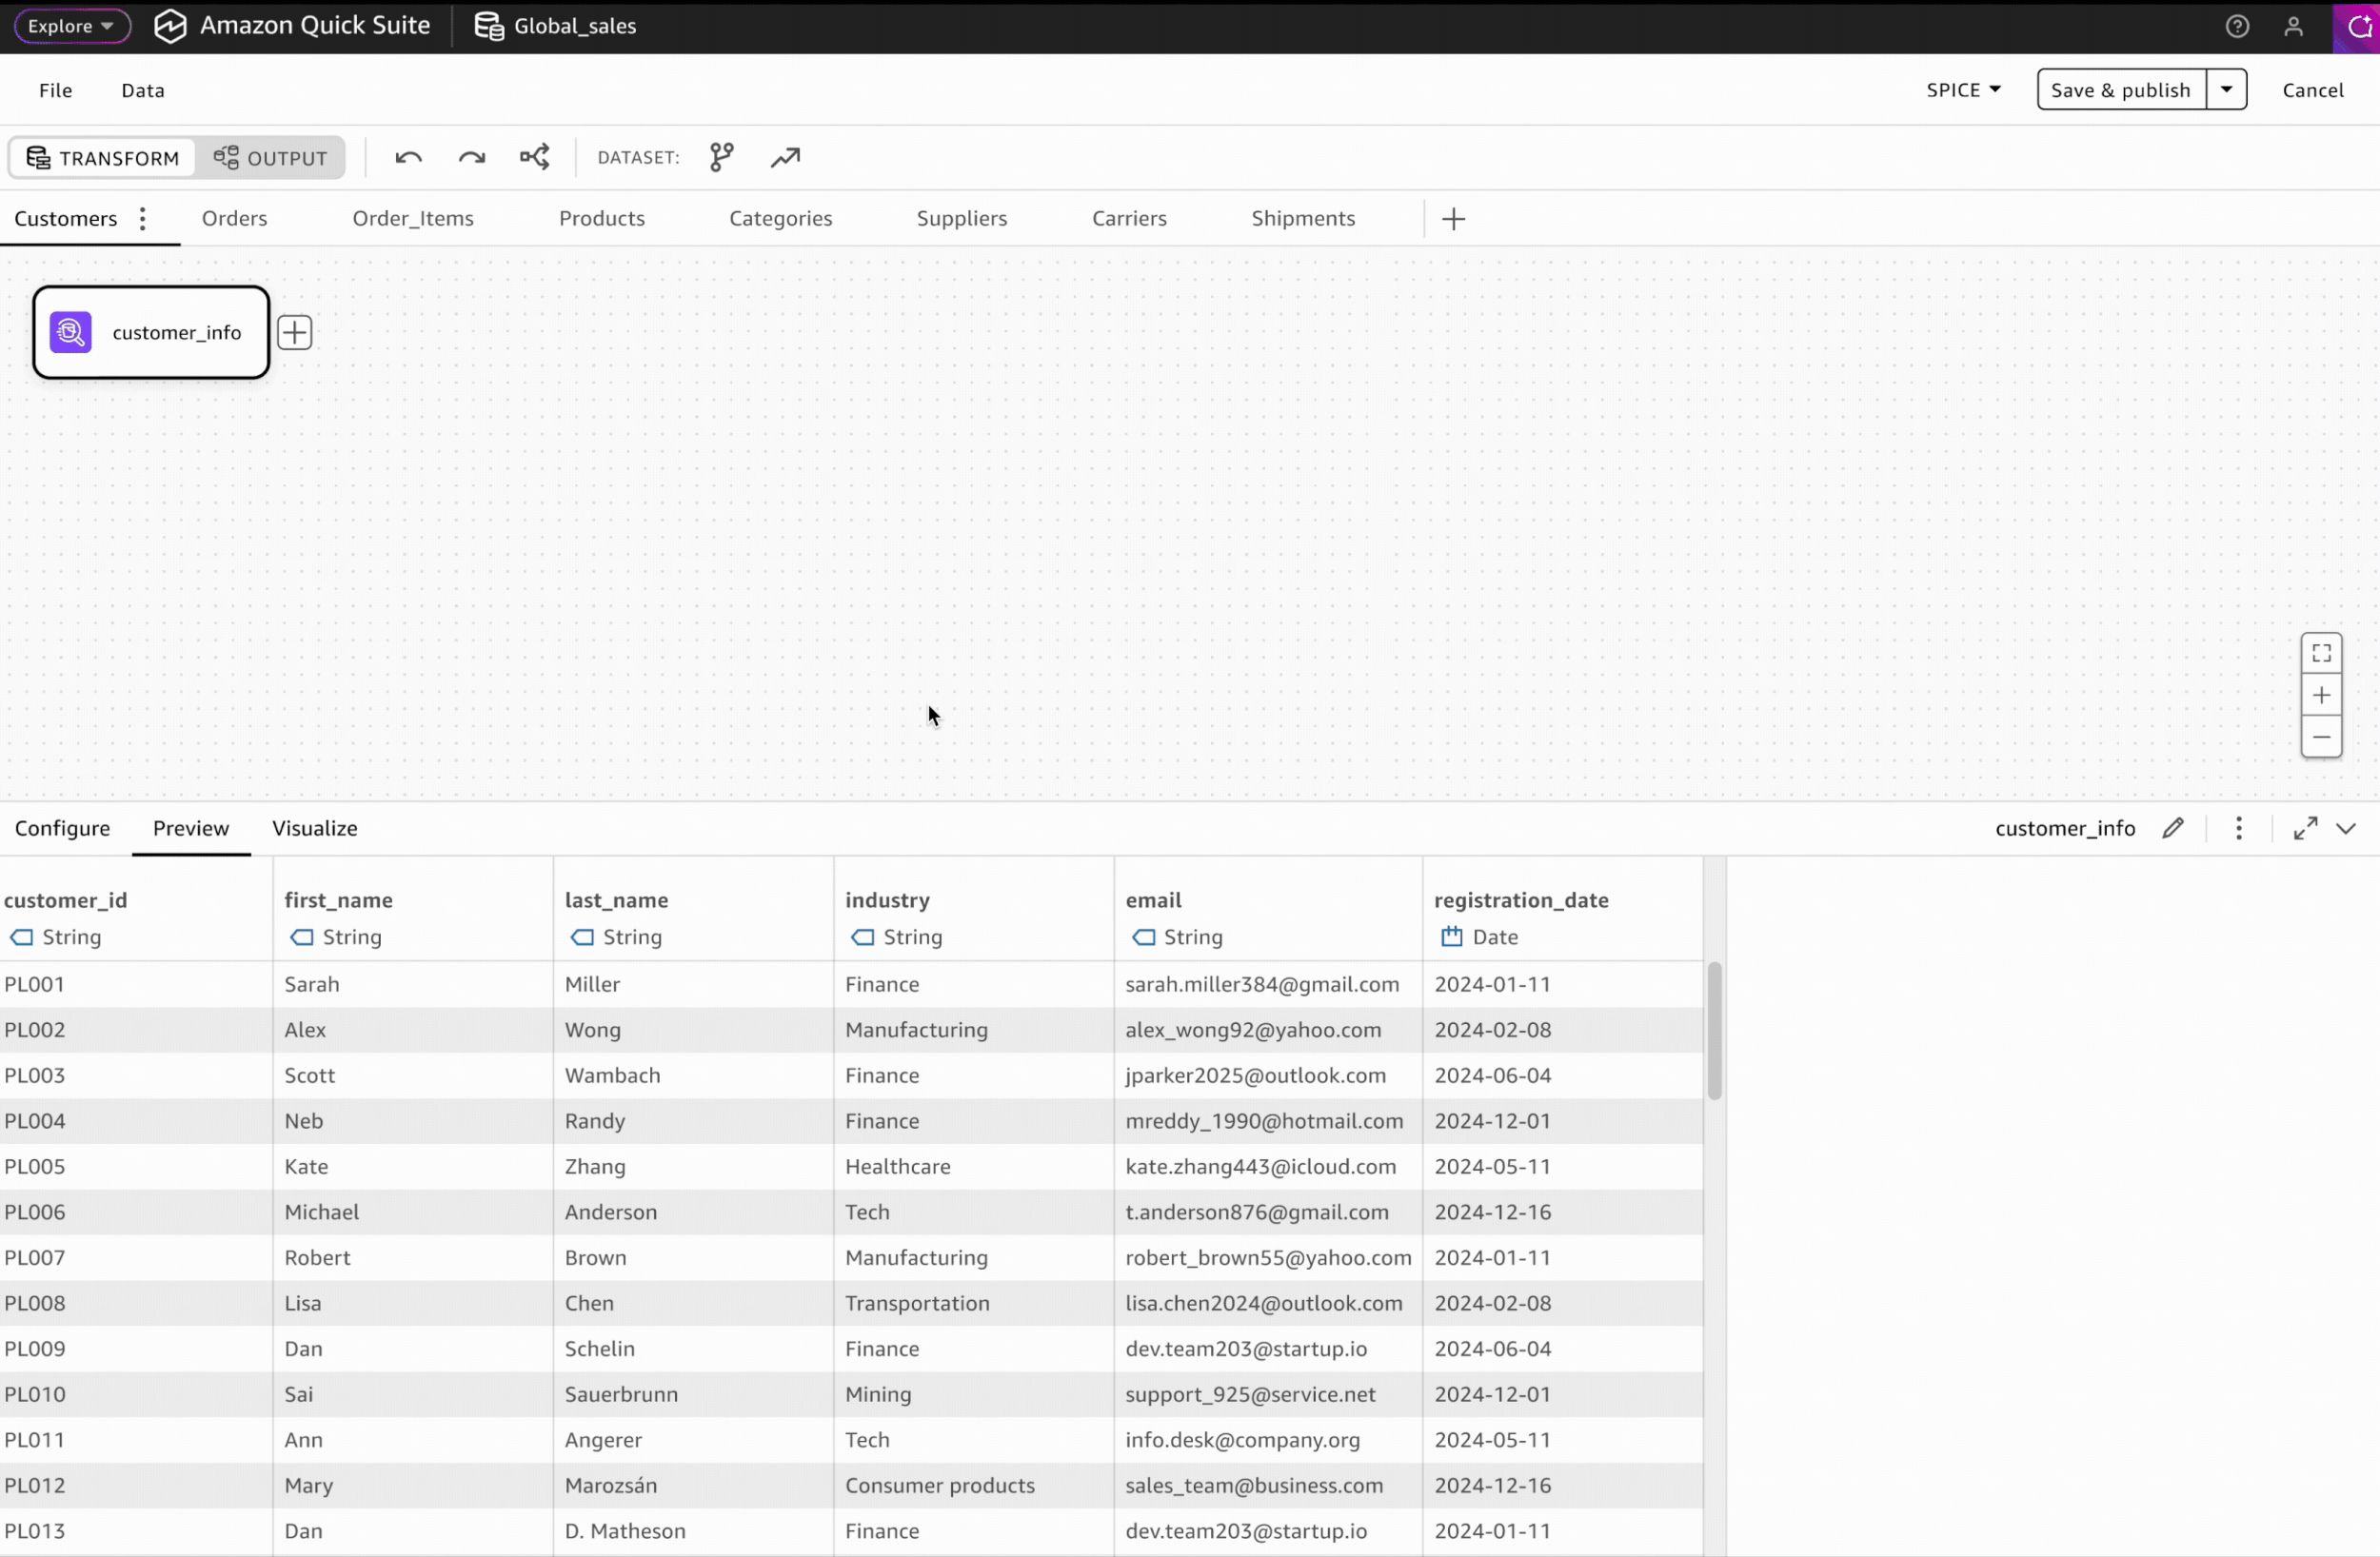
Clicking on any transformation step opens a dedicated interface with two key areas: a configure tab for modifying settings and a data preview tab for validating results, providing users with immediate visual feedback on their changes.
Interaction Design: Configure and validate
For both technical and non-technical data users, result validation is critical to building trust. To reduce cognitive load, I separated the transformation interface into two distinct spaces: configuration and preview.
After configuring a transformation, users can validate output in the data preview panel, where column filters help them focus on modified columns only.
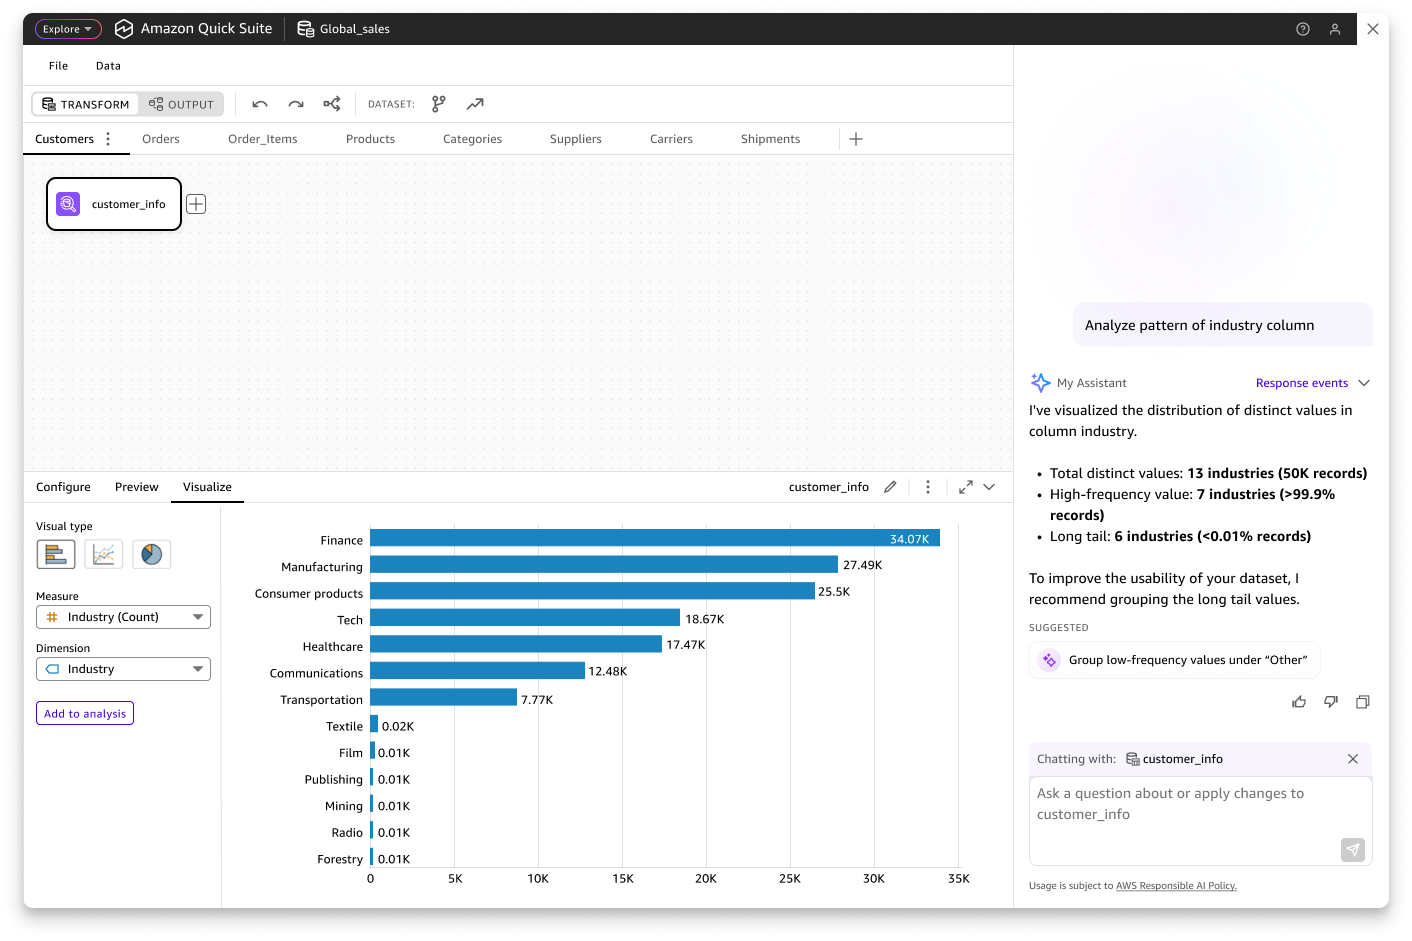
V1 Limitation: Visual data distributions (histograms, charts) weren't feasible due to engineering constraints, creating a capability gap compared to competitors. This limits users' ability to quickly understand data patterns visually. To address this, I explored AI-based solutions as a post-GA enhancement for intelligent data profiling.
Interaction Patterns Across Transformations
Consistency in transformation configuration is essential for user efficiency. Recognizing that transformations vary in complexity, I selected two interaction patterns based on Quick Sight's design system:
Simple column selector for straightforward tasks that modify a single column at a time.
Table format with inline editing for complex tasks involving multiple columns, allowing users to focus on one row at a time.

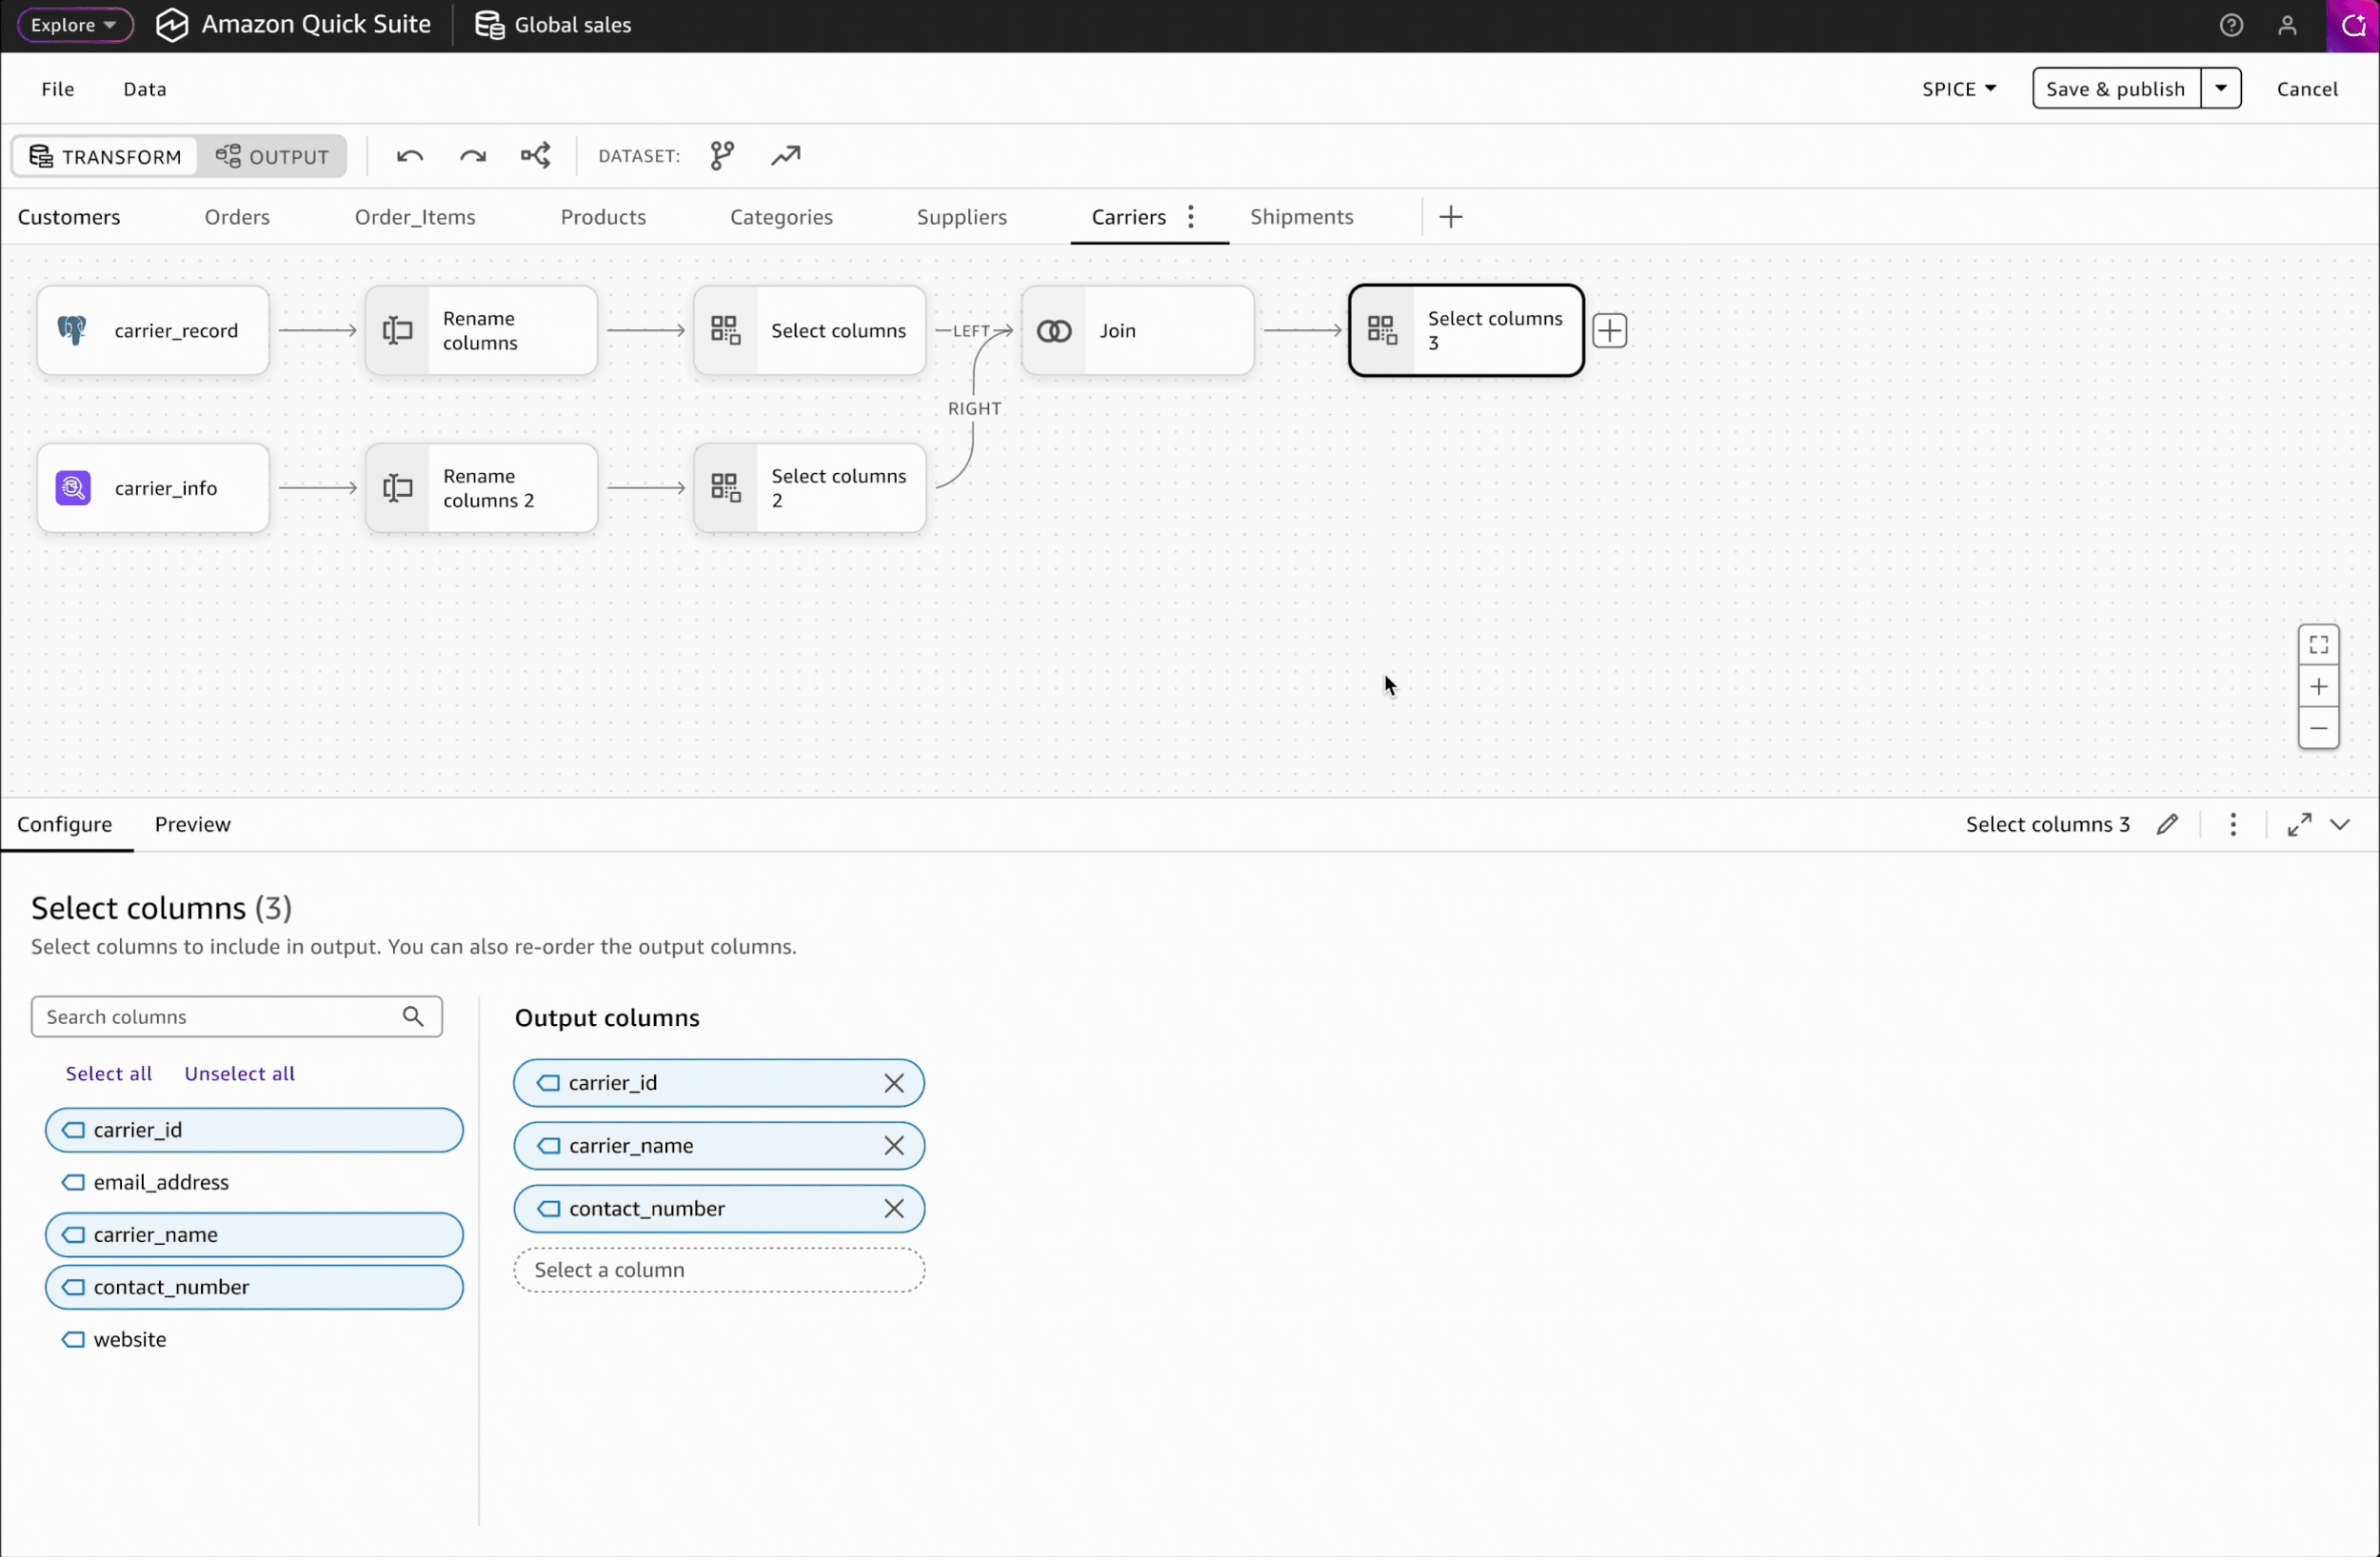
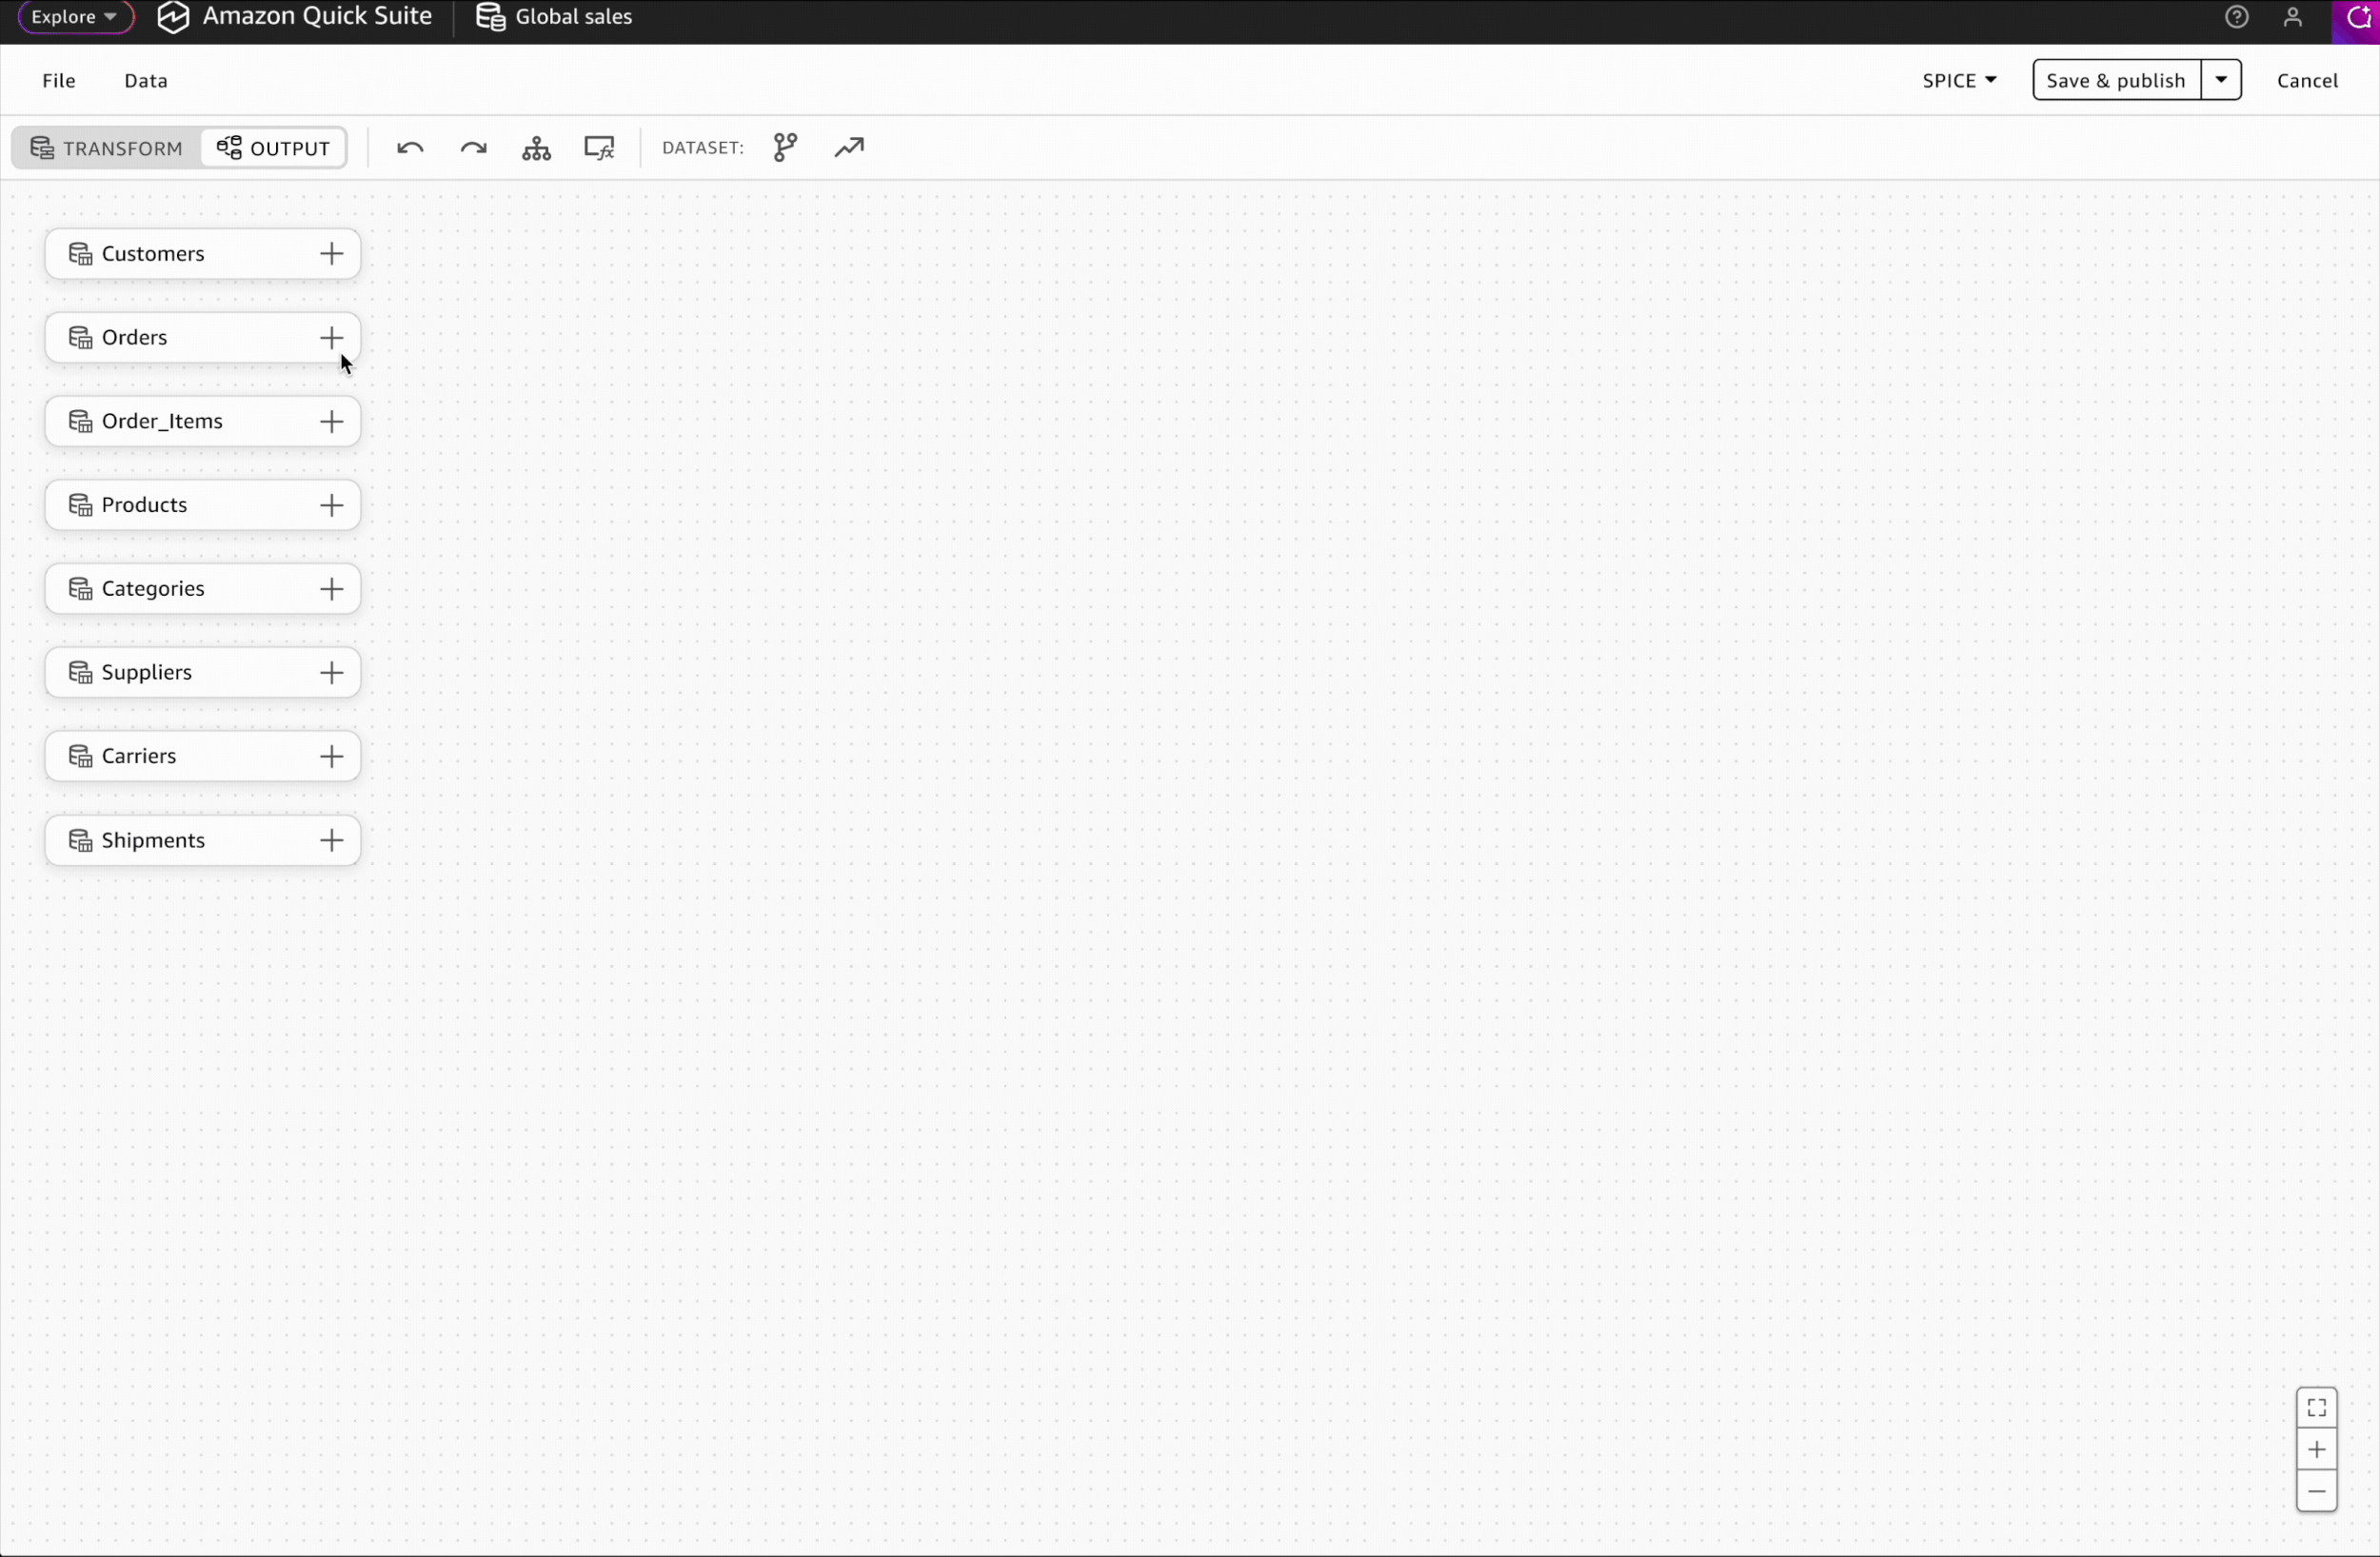
Milestone 2Multi-table dataset
After completing UX design of multi-step data transformation for single-table dataset, I advanced to the next phase: adding data modeling capabilities. This functionality is essential for competitive parity and enables users to maintain optimal data granularity while reducing query load by creating joins on-the-fly during analysis, rather than querying large pre-joined tables.
Adding data modeling required scaling the interface to support both data transformation and modeling in a unified editor, allowing users to create multiple output tables. I proactively partnered with the product manager to define an architecture that simplified both the technical solution and resulting user experience.
Scaling Up the UI

Adding data modeling capabilities required modifying the interface architecture to set it up for optimal scalability. I approached these modifications with three guiding principles: ensuring users could easily distinguish between different dataset areas, enabling continuous and flexible editing workflows, and maintaining a consistent editing experience throughout the editor.
Key Design Decisions
Simplified two-workspace architecture: Granular workspace categorization increases cognitive load and limits scalability. I collaborated with product and engineering to establish a simpler structure: Transform (data layer) for data transformation, and Output (semantics layer) for relationships, metadata, and definitions.
Task-focused naming: Research with internal customers revealed varied interpretations of industry terms like "data preparation" and "data modeling." I proposed "Transform" and "Output"—task-focused names rather than technical jargons, which stakeholders approved for better clarity.
Interaction Design: Switching Between Transform & Output
To ensure seamless and flexible editing, I provided multiple ways for users to switch between Transform and Output: through the toolbar for direct navigation and contextual actions for in-flow transitions.
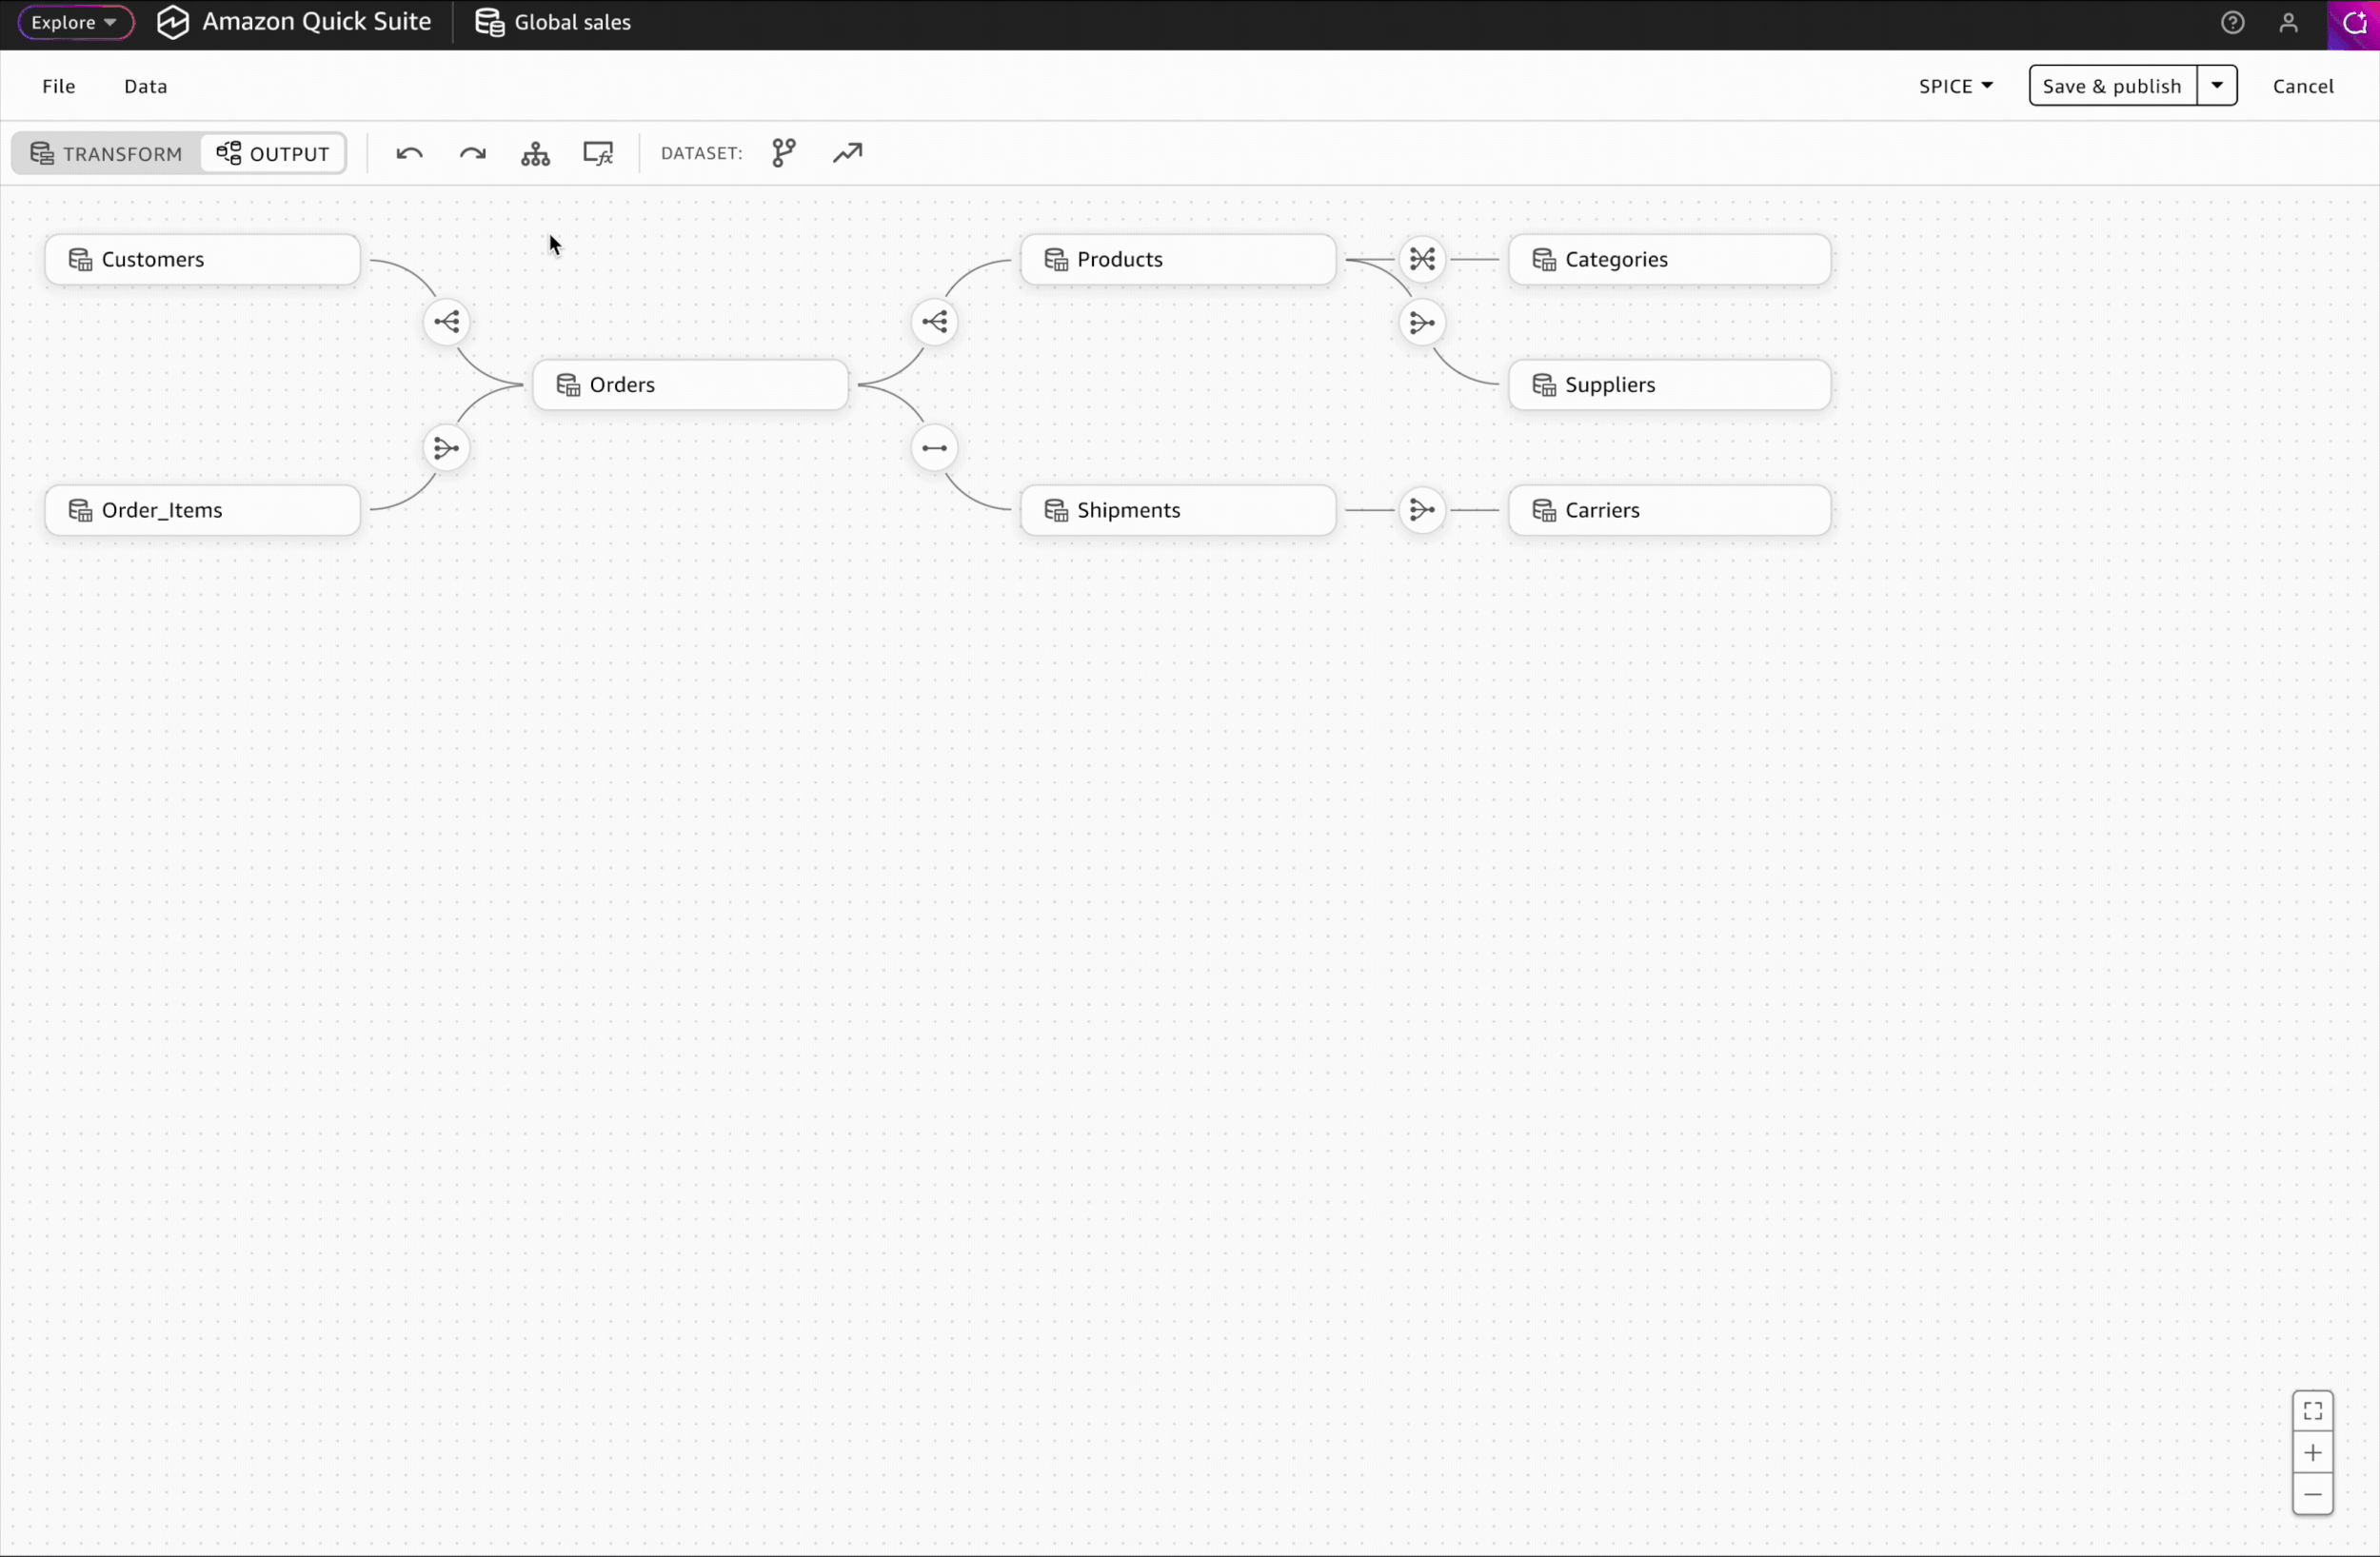
Interaction Design: Adding Relationships
I designed the relationship-adding interaction to match the transformation step pattern, enabling users to leverage existing knowledge and work intuitively without additional learning.
End-to-End User Flow: Creating & Editing Datasets
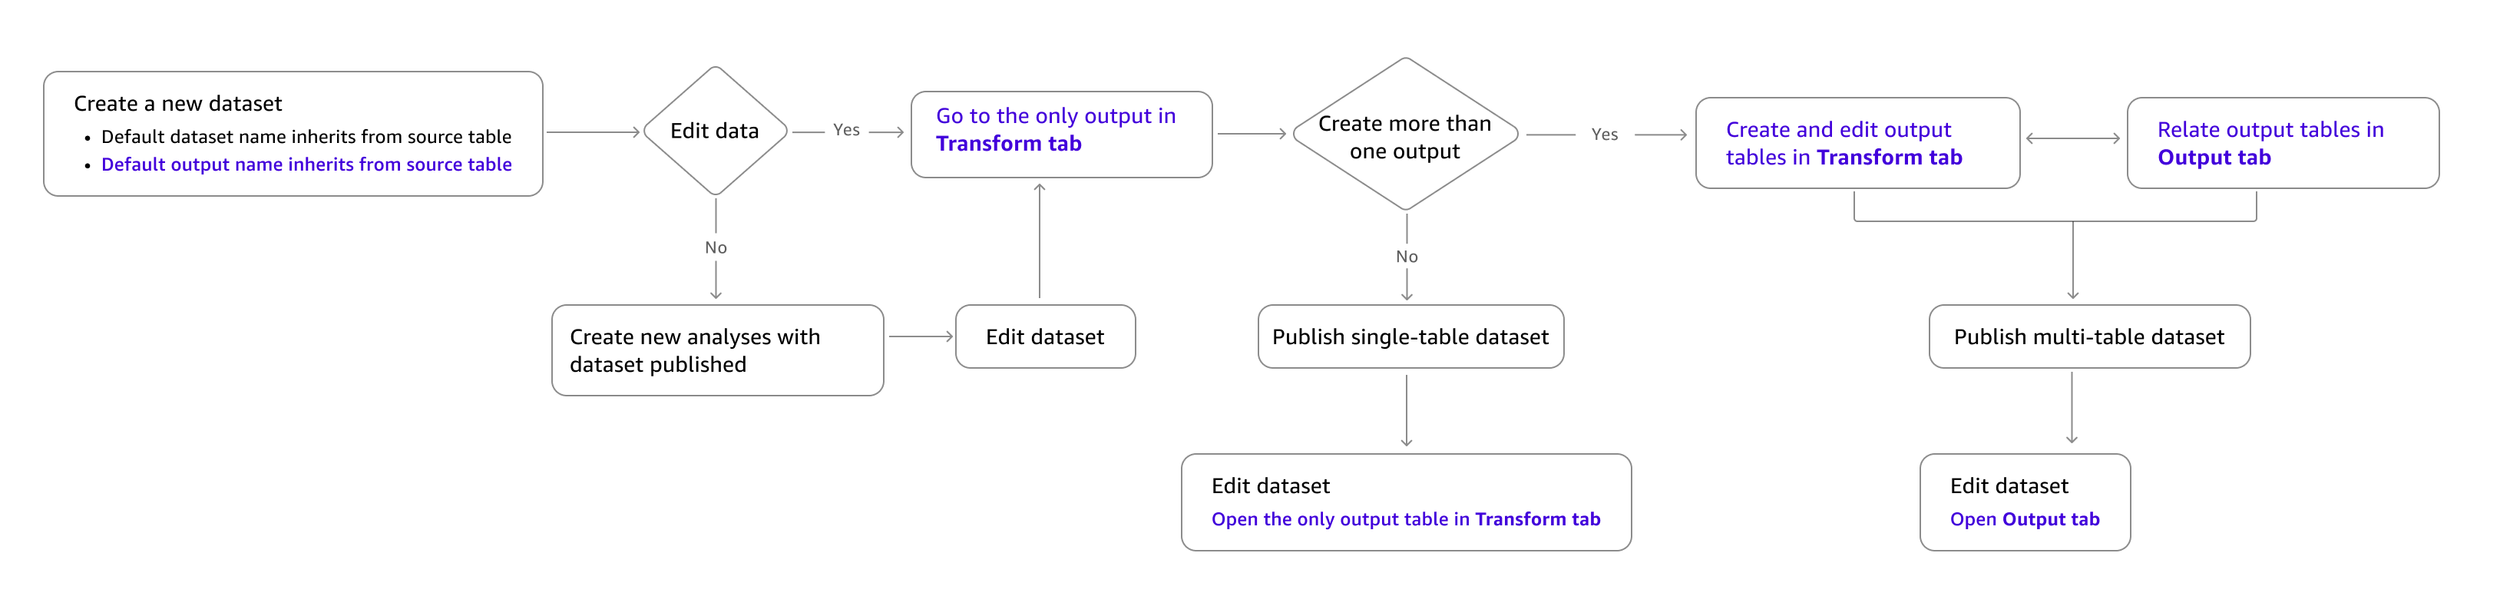
I simplified the end-to-end flow for creating and editing datasets while accommodating both single-table and multi-table capabilities. Transform is the default landing space for new datasets, based on two key findings:
Internal user research showed users struggled when asked to choose between data preparation and modeling upfront without understanding the purpose of each task.
Survey data revealed data preparation is a more common task than data modeling.
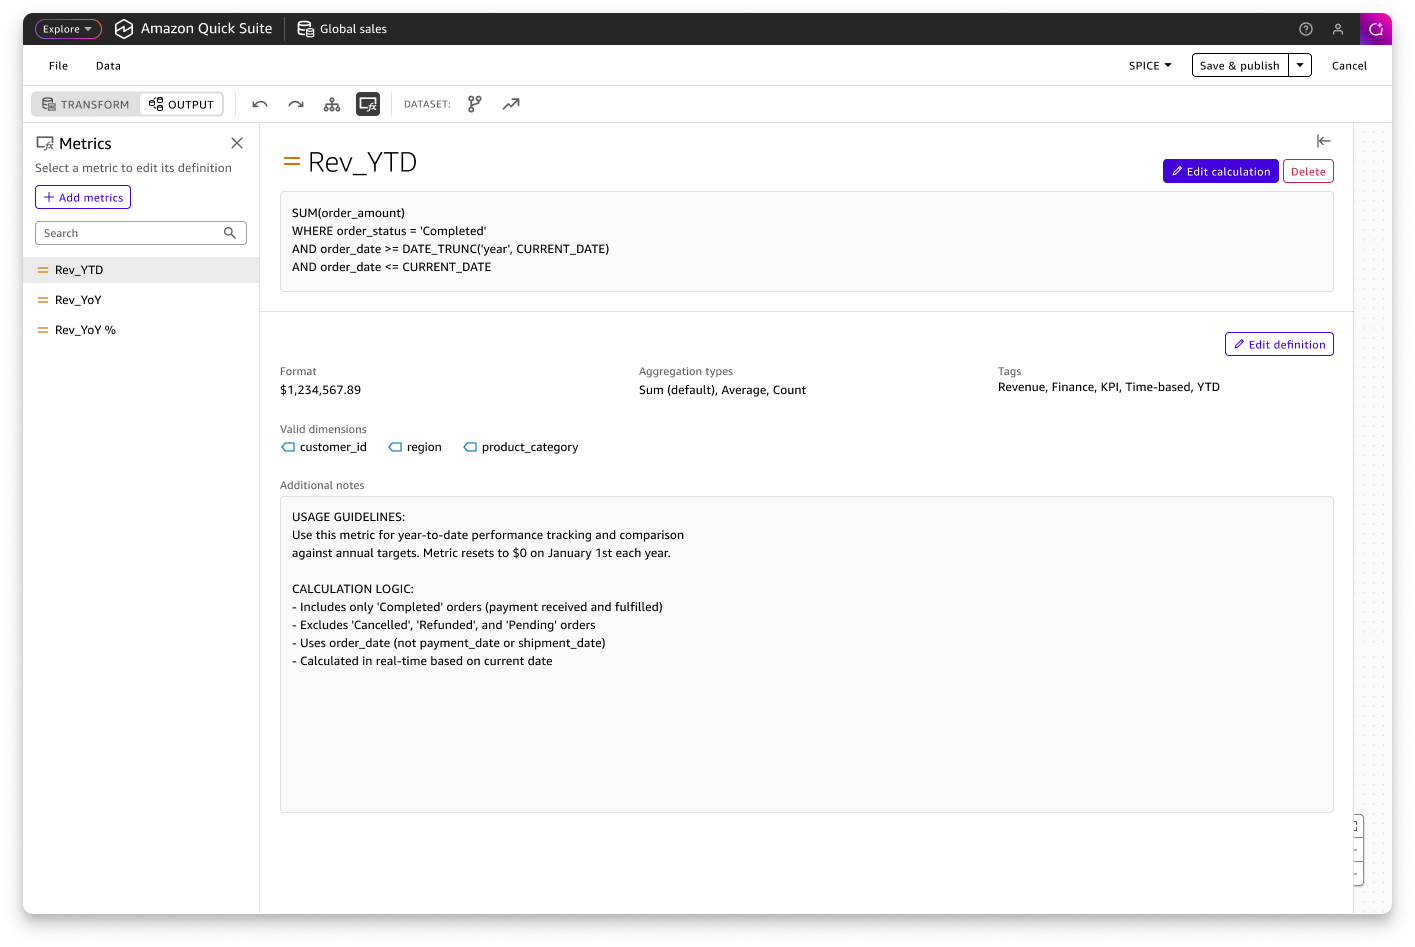
Business Definitions
Milestone 3 (Concept Stage)The semantics layer enables users to document metadata and business definitions for their datasets, creating a trusted source of truth for both human analysts and AI agents. This leads to more accurate and trustworthy analysis across the organization. UX design is currently in the concept stage.
Interaction Design: Accessing Schema & Metrics
In the Output workspace, users can view their complete multi-table dataset schema, add business context to tables and columns, and create reusable metrics for consistent downstream analysis.

AI-Assisted Data Preparation
AI Vision (Concept Stage)With the emergence of agentic AI in data and analytics, I envision potential for AI to boost data preparation efficiency by helping users analyze and understand data patterns, detect anomalies, and automate transformation workflows.
With human-in-the-loop collaboration, AI assistance can enhance trust in data quality and the insights derived from it.
I developed use case-driven concepts that leveraged AI interaction patterns from Amazon Quick Suite to influence product vision and roadmap in data preparation.
AI-Assisted Data Profiling
Our V1 data preparation tool lacks intuitive visual data profiling capabilities, limiting users' ability to quickly understand data patterns. This also creates a significant capability gap when compared to competitive visual data preparation products.
To address this gap, I proposed an AI-powered data profiling solution as a strategic post-GA enhancement. This solution will enable users to easily visualize and understand data pattern and get informed with data quality recommendations.
Build with AI
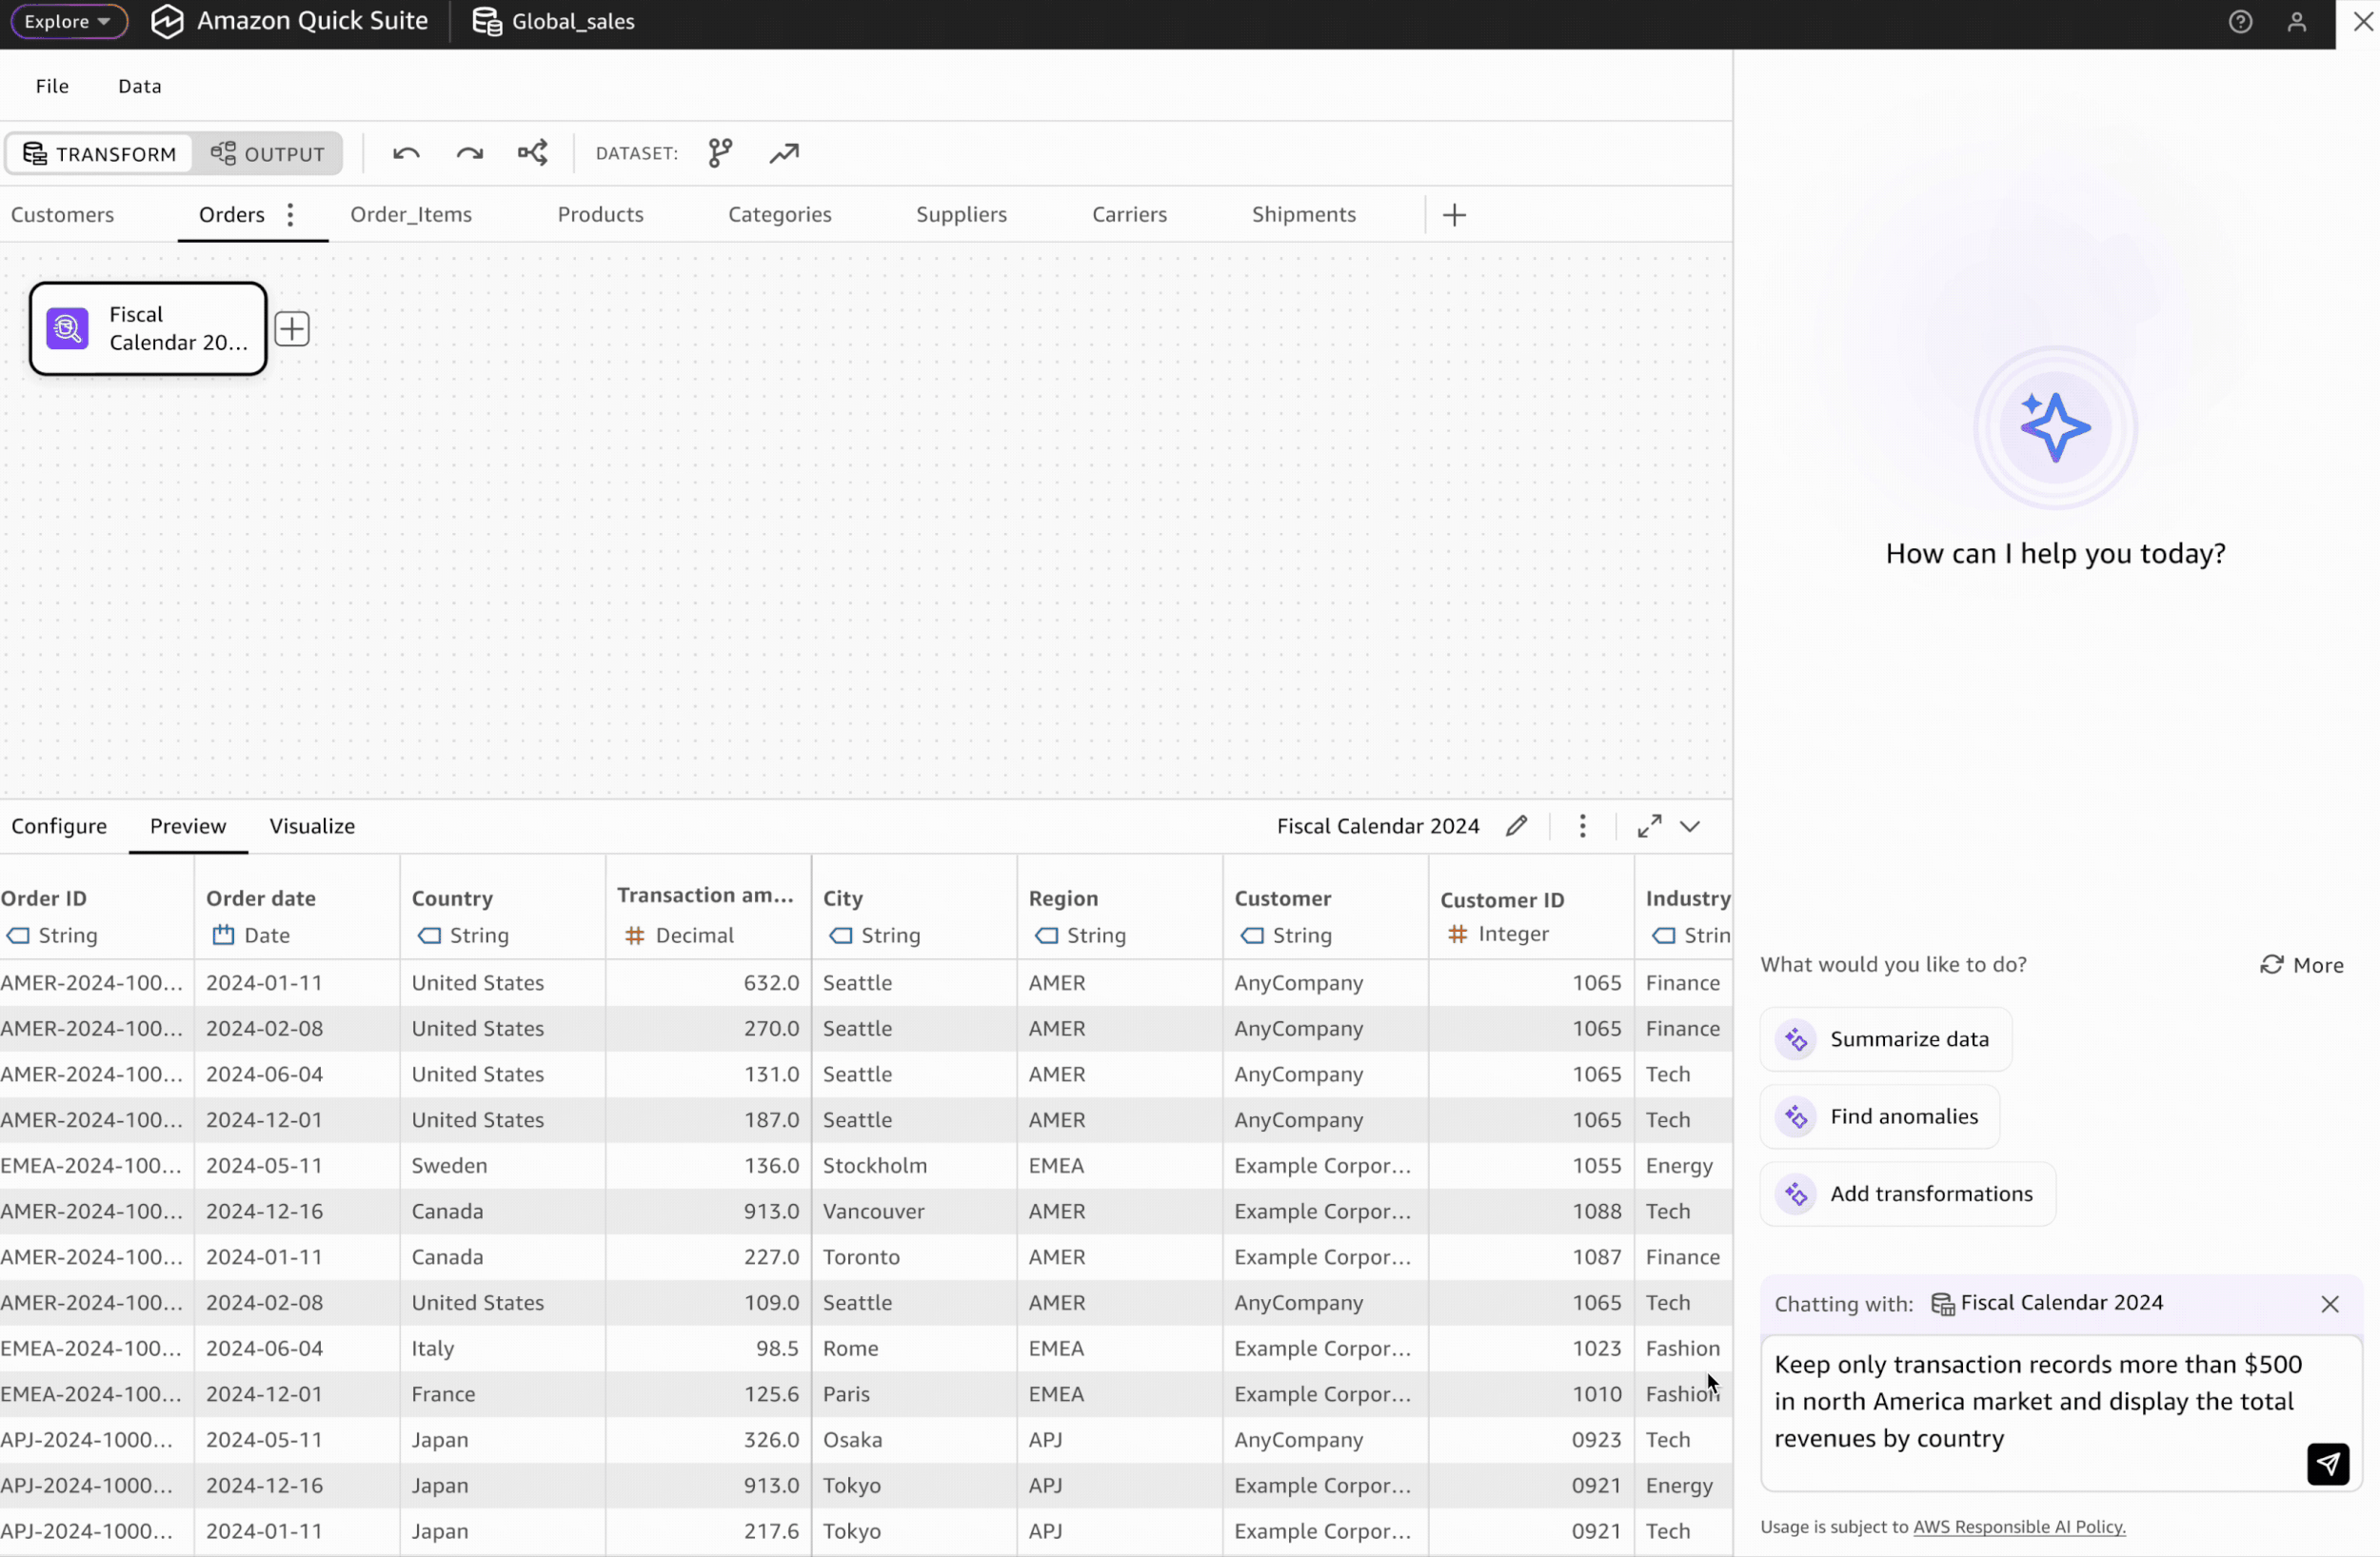
Users can prompt AI agents to automatically generate transformation workflows. However, human-in-the-loop validation remains critical for building user trust.
AI-generated transformation steps are visually highlighted and differentiated from manually created steps, enabling users to validate the accuracy of each automated step.